Project update 4 of 10
Logic Analyzer — Quick Start & Full Tutorial
by Andrew LiWe are excited to announce that the Logic Analyzer feature of ESP32JTAG is now fully functional. Both the hardware and the Web User Interface are working even better than expected.
The following tutorial will guide you through the entire workflow, from opening the interface to capturing waveforms, configuring triggers, measuring signals, and loading saved captures. Whether you’re a beginner or an advanced user, this guide should help you get the most out of the ESP32JTAG logic analyzer.
1. Getting Started
1.1 Access the Web Interface
- Power on your ESP32JTAG device
- Note the IP address shown on the device’s LED display
- Open your browser and enter this IP address
You will see the home screen of the ESP32JTAG web interface.
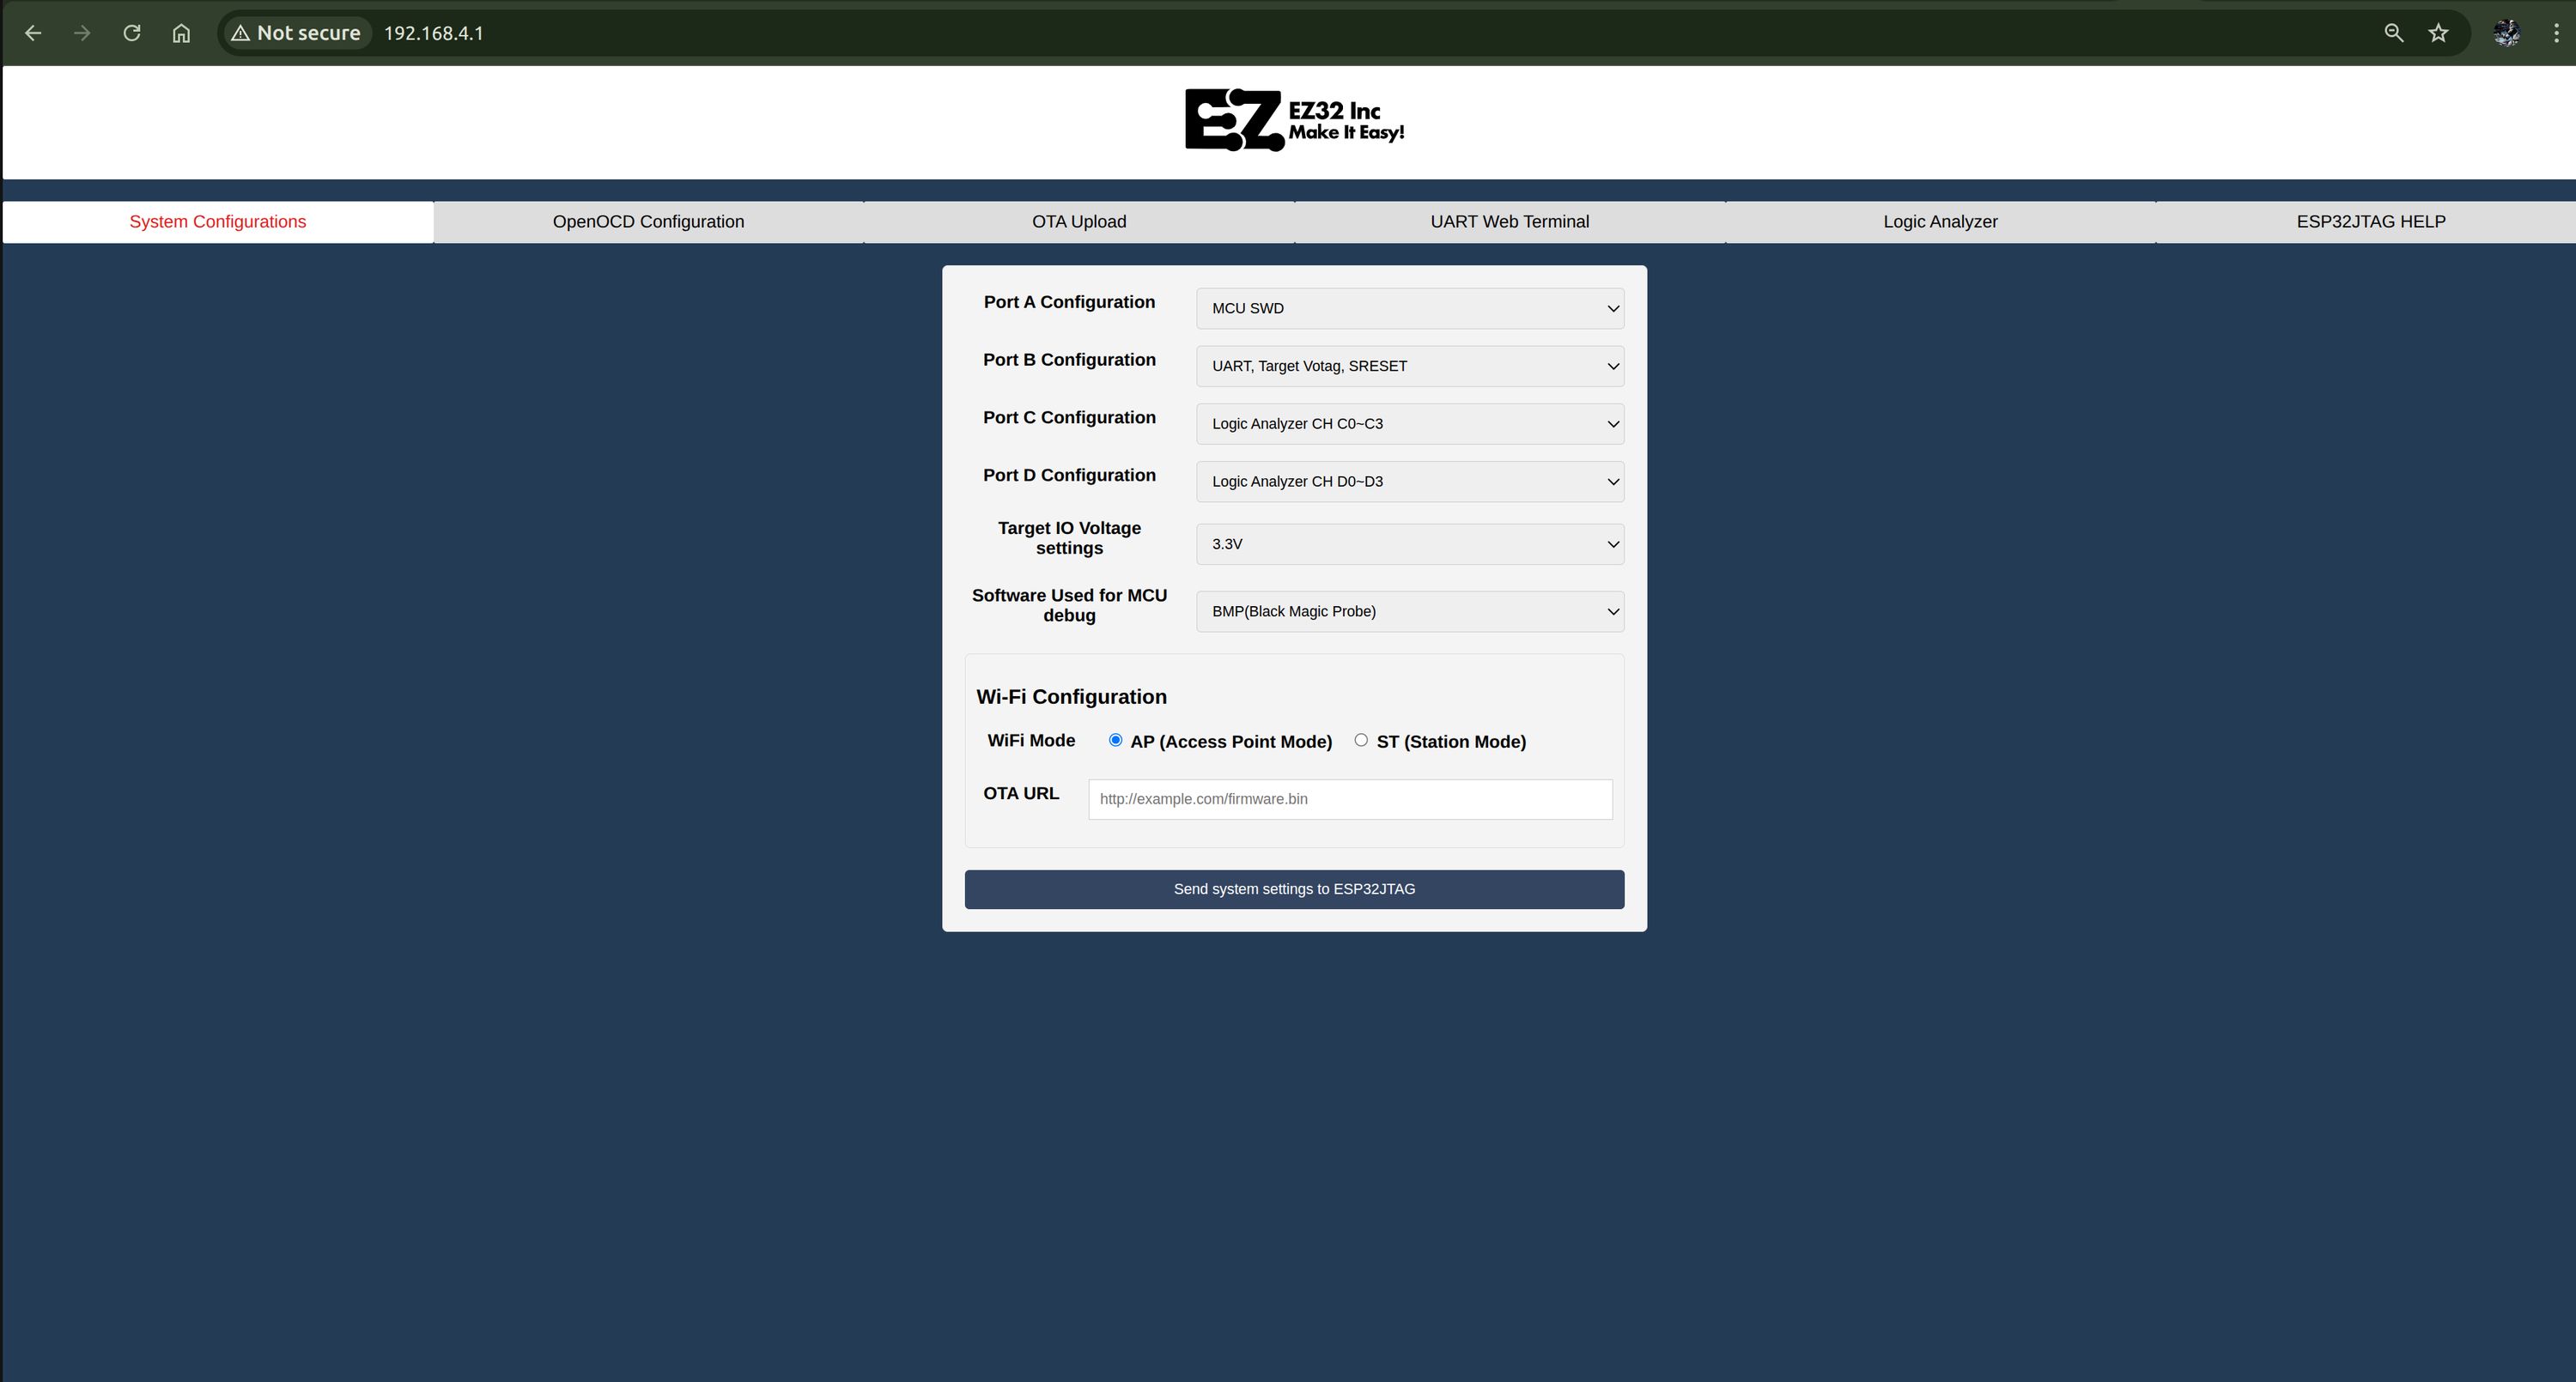
If a port is configured for another function (such as JTAG), its pins cannot be externally connected to other signals. However, you can still capture and observe the signals present on those pins.
This is actually a unique advantage compared to other tools. You can use the logic analyzer to check whether or not there is activity on the JTAG pins, whether the SRST signal is high or low, whether UART TX/RX lines are toggling, and so on. This greatly helps during debugging!
We’ll explore this in more detail in upcoming tutorials that cover using the logic analyzer alongside MCU debugging.
2. Instant Capture (Quick Demonstration)
For those who want to immediately see results, here’s the fastest way:
- In the top navigation, click Logic Analyzer.
- Click Instant Capture.
- Bingo! You’ll instantly see a full waveform view of all 16 internal channels sampled at up to 264 MHz.
This provides an immediate look at what the device can do.
3. Capture Settings Explained
Click Settings to open the configuration dialog. This is the heart of the logic analyzer.
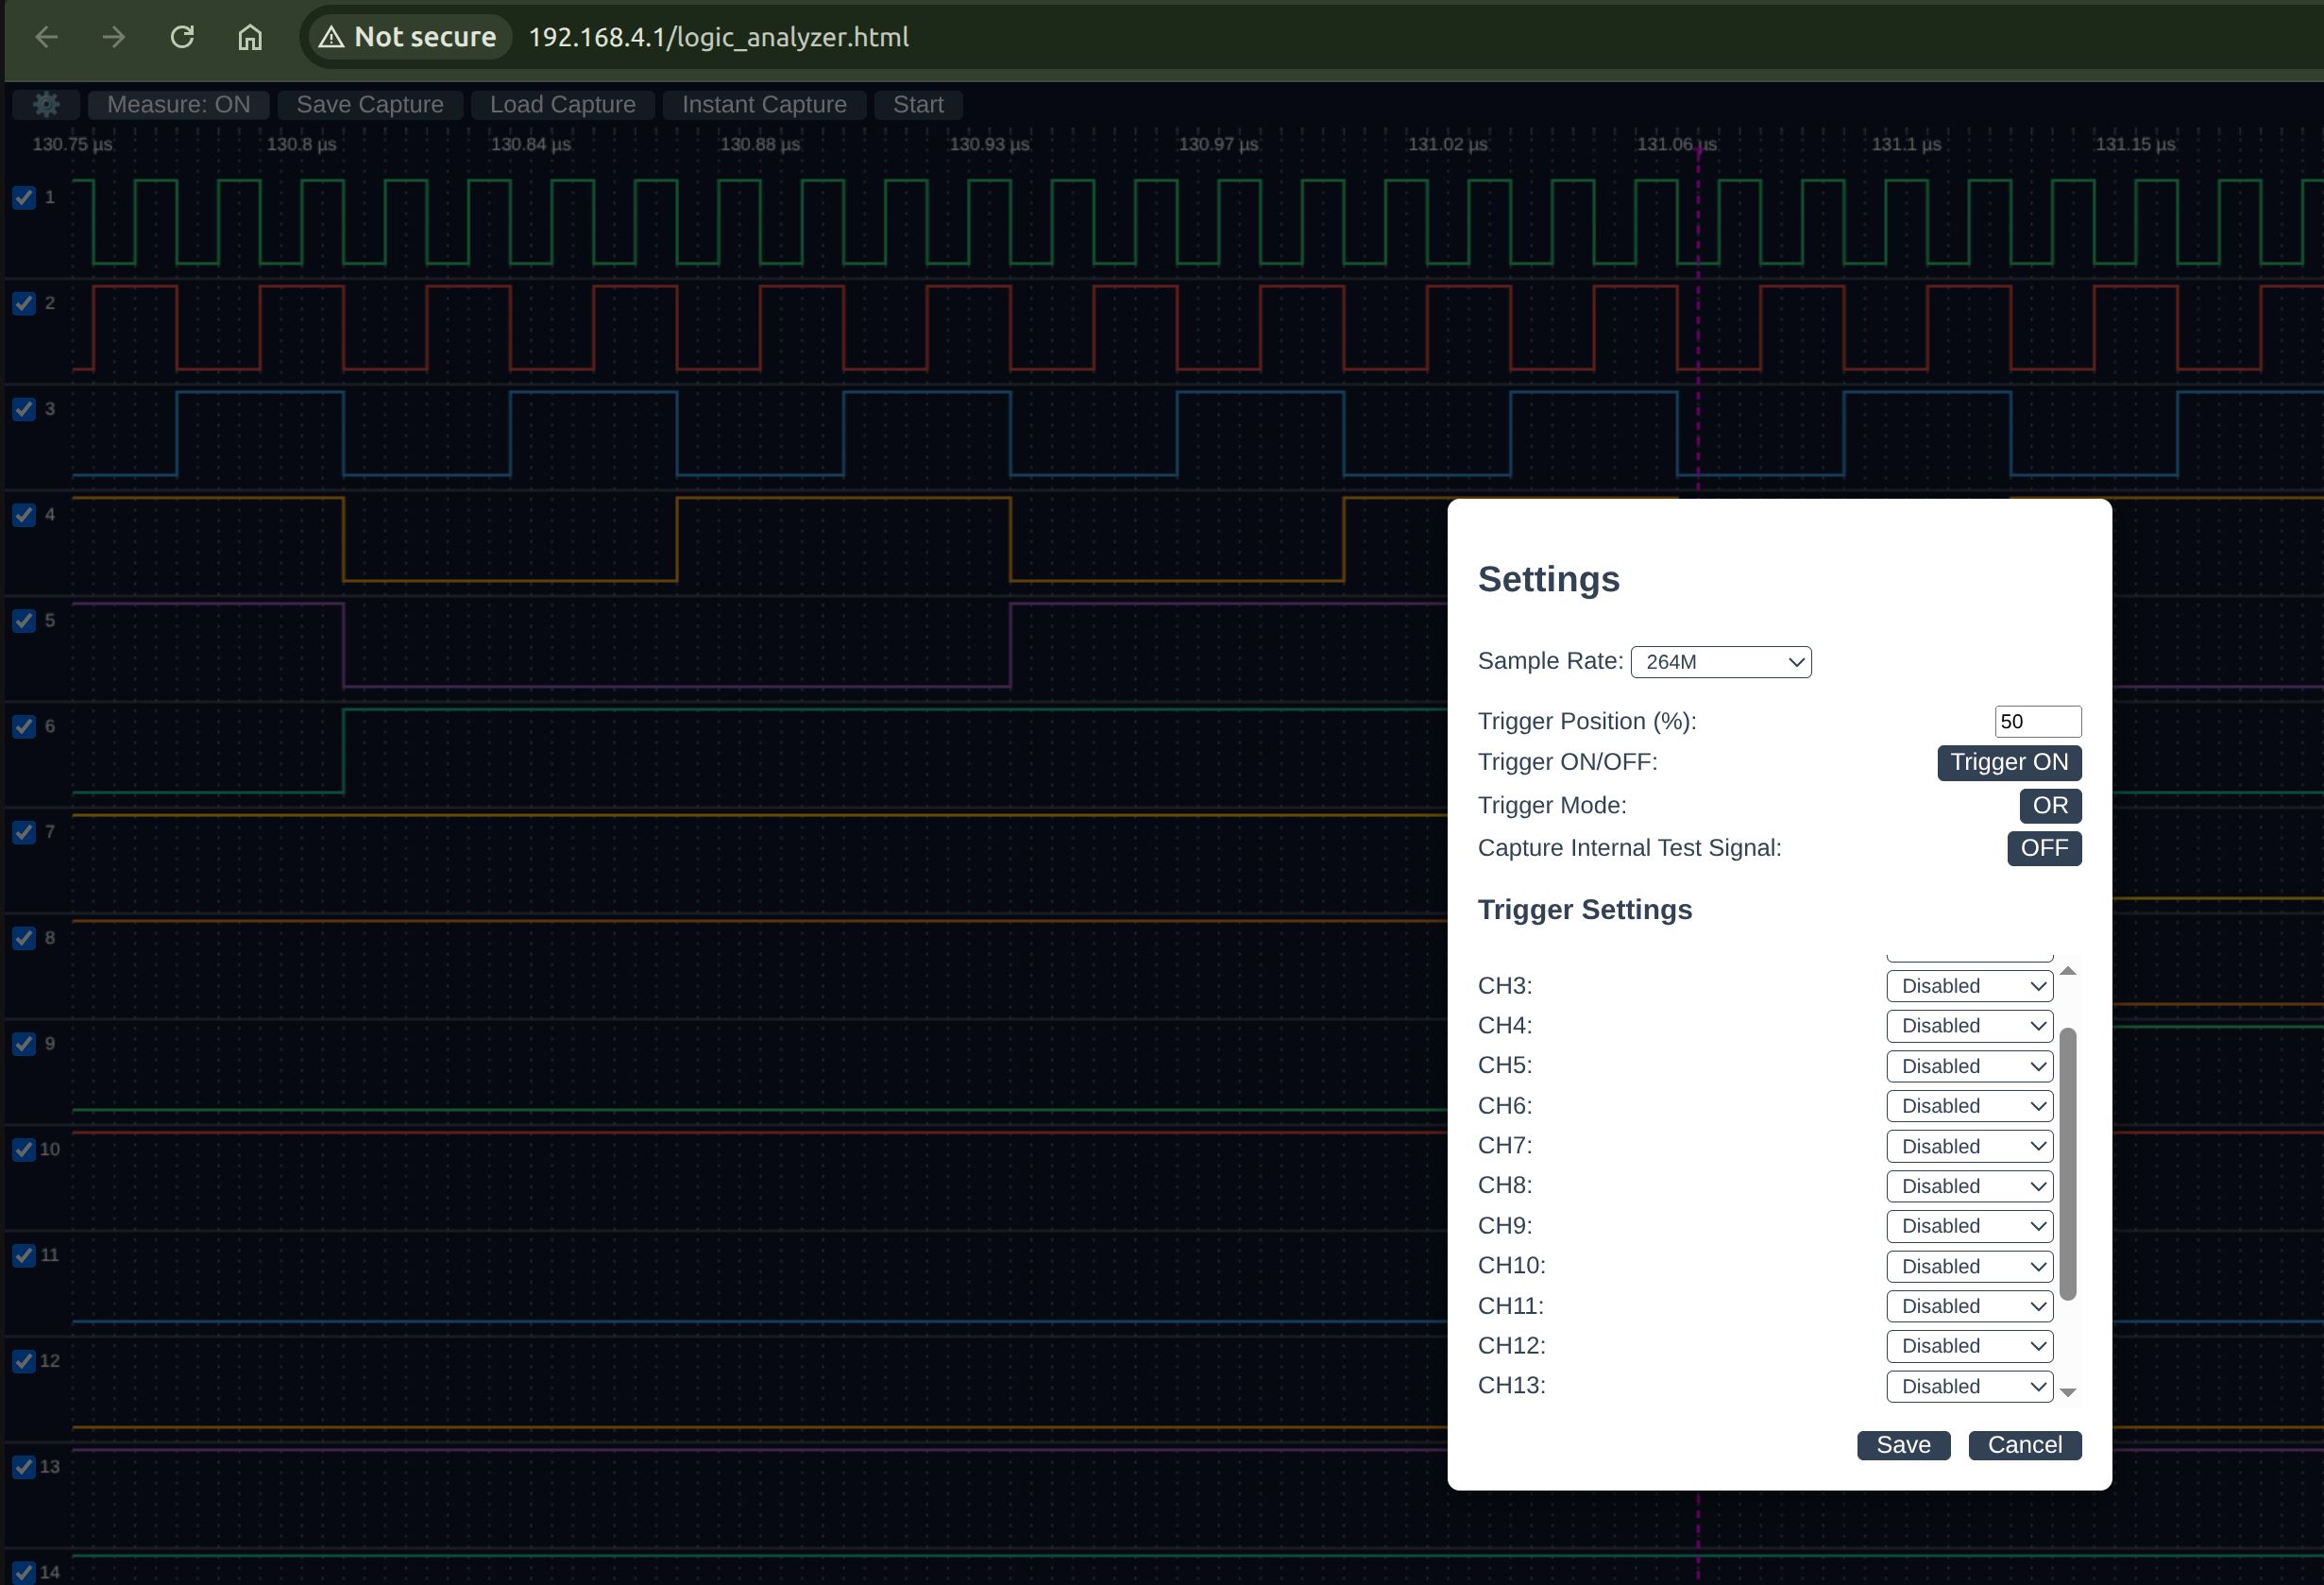
3.1 Sample Rate
- Maximum speed: 264 MHz (higher than the originally planned 250 MHz!)
- Minimum speed: 260 Hz
- Choose a value depending on what you need to analyze.
3.2 Trigger Position
Controls where the trigger event appears in your captured window.
- Example: 50% = trigger is in the middle
- Higher values → more post-trigger data
- Lower values → more pre-trigger data
3.3 Trigger Enable
- On = capture waits for the trigger condition
- Off = capture starts immediately
3.4 Trigger Mode: OR vs AND
- OR: Trigger fires when any enabled channel matches
- AND: Trigger fires only when all enabled channels match simultaneously
3.5 Capture Internal Test Signal: ON/OFF
Choose the data source from between:
- Internal Test Signal Generator
- Real IO Port Signals
The internal generator is ideal for:
- Self-testing
- Getting familiar with the UI
- Using the analyzer without wiring anything
After adjusting your settings, click Save. The current configuration is always displayed in the bottom status bar.
3.6 Per-Channel Trigger Configuration
Each channel (1–16) supports:
- Rising edge
- Falling edge
- Crossing (rising or falling)
- High level
- Low level
- Disabled (ignored during trigger)
This provides precise trigger control.
4. Capturing Waveforms
4.1 Triggered Capture
- Set trigger conditions in Settings.
- Click Start.
The analyzer waits for the trigger.
If nothing matches the trigger condition, it continues waiting until you cancel or update the condition.
4.2 Navigating the Waveform
You can:
- Scroll wheel → zoom in/out
- Arrow keys → move left/right
- “+ / –” keys → zoom
- Hover mouse → see timing between edges
Navigation is designed to feel like a desktop logic analyzer.
5. Measurement Tools
Enable Measure mode for automatic signal analysis. When you click on a channel, you will see:
- Rising edge count
- Falling edge count
- Calculated frequency
- Duration between edges (shown on hover)
Right-click to exit measurement mode.
6. Saving & Loading Captures
6.1 Save a Capture
Click Save Capture to export the waveform as a .bin file.
6.2 Load a Capture
Click Load Capture and select a previously saved .bin file.
Once loaded:
- The interface behaves just like real-time mode
- Measurements, zooming, and navigation all work
- The status bar shows Data Source: Saved File
Perfect for sharing data, debugging later, or documenting issues.
7. A Real Setup and Capture
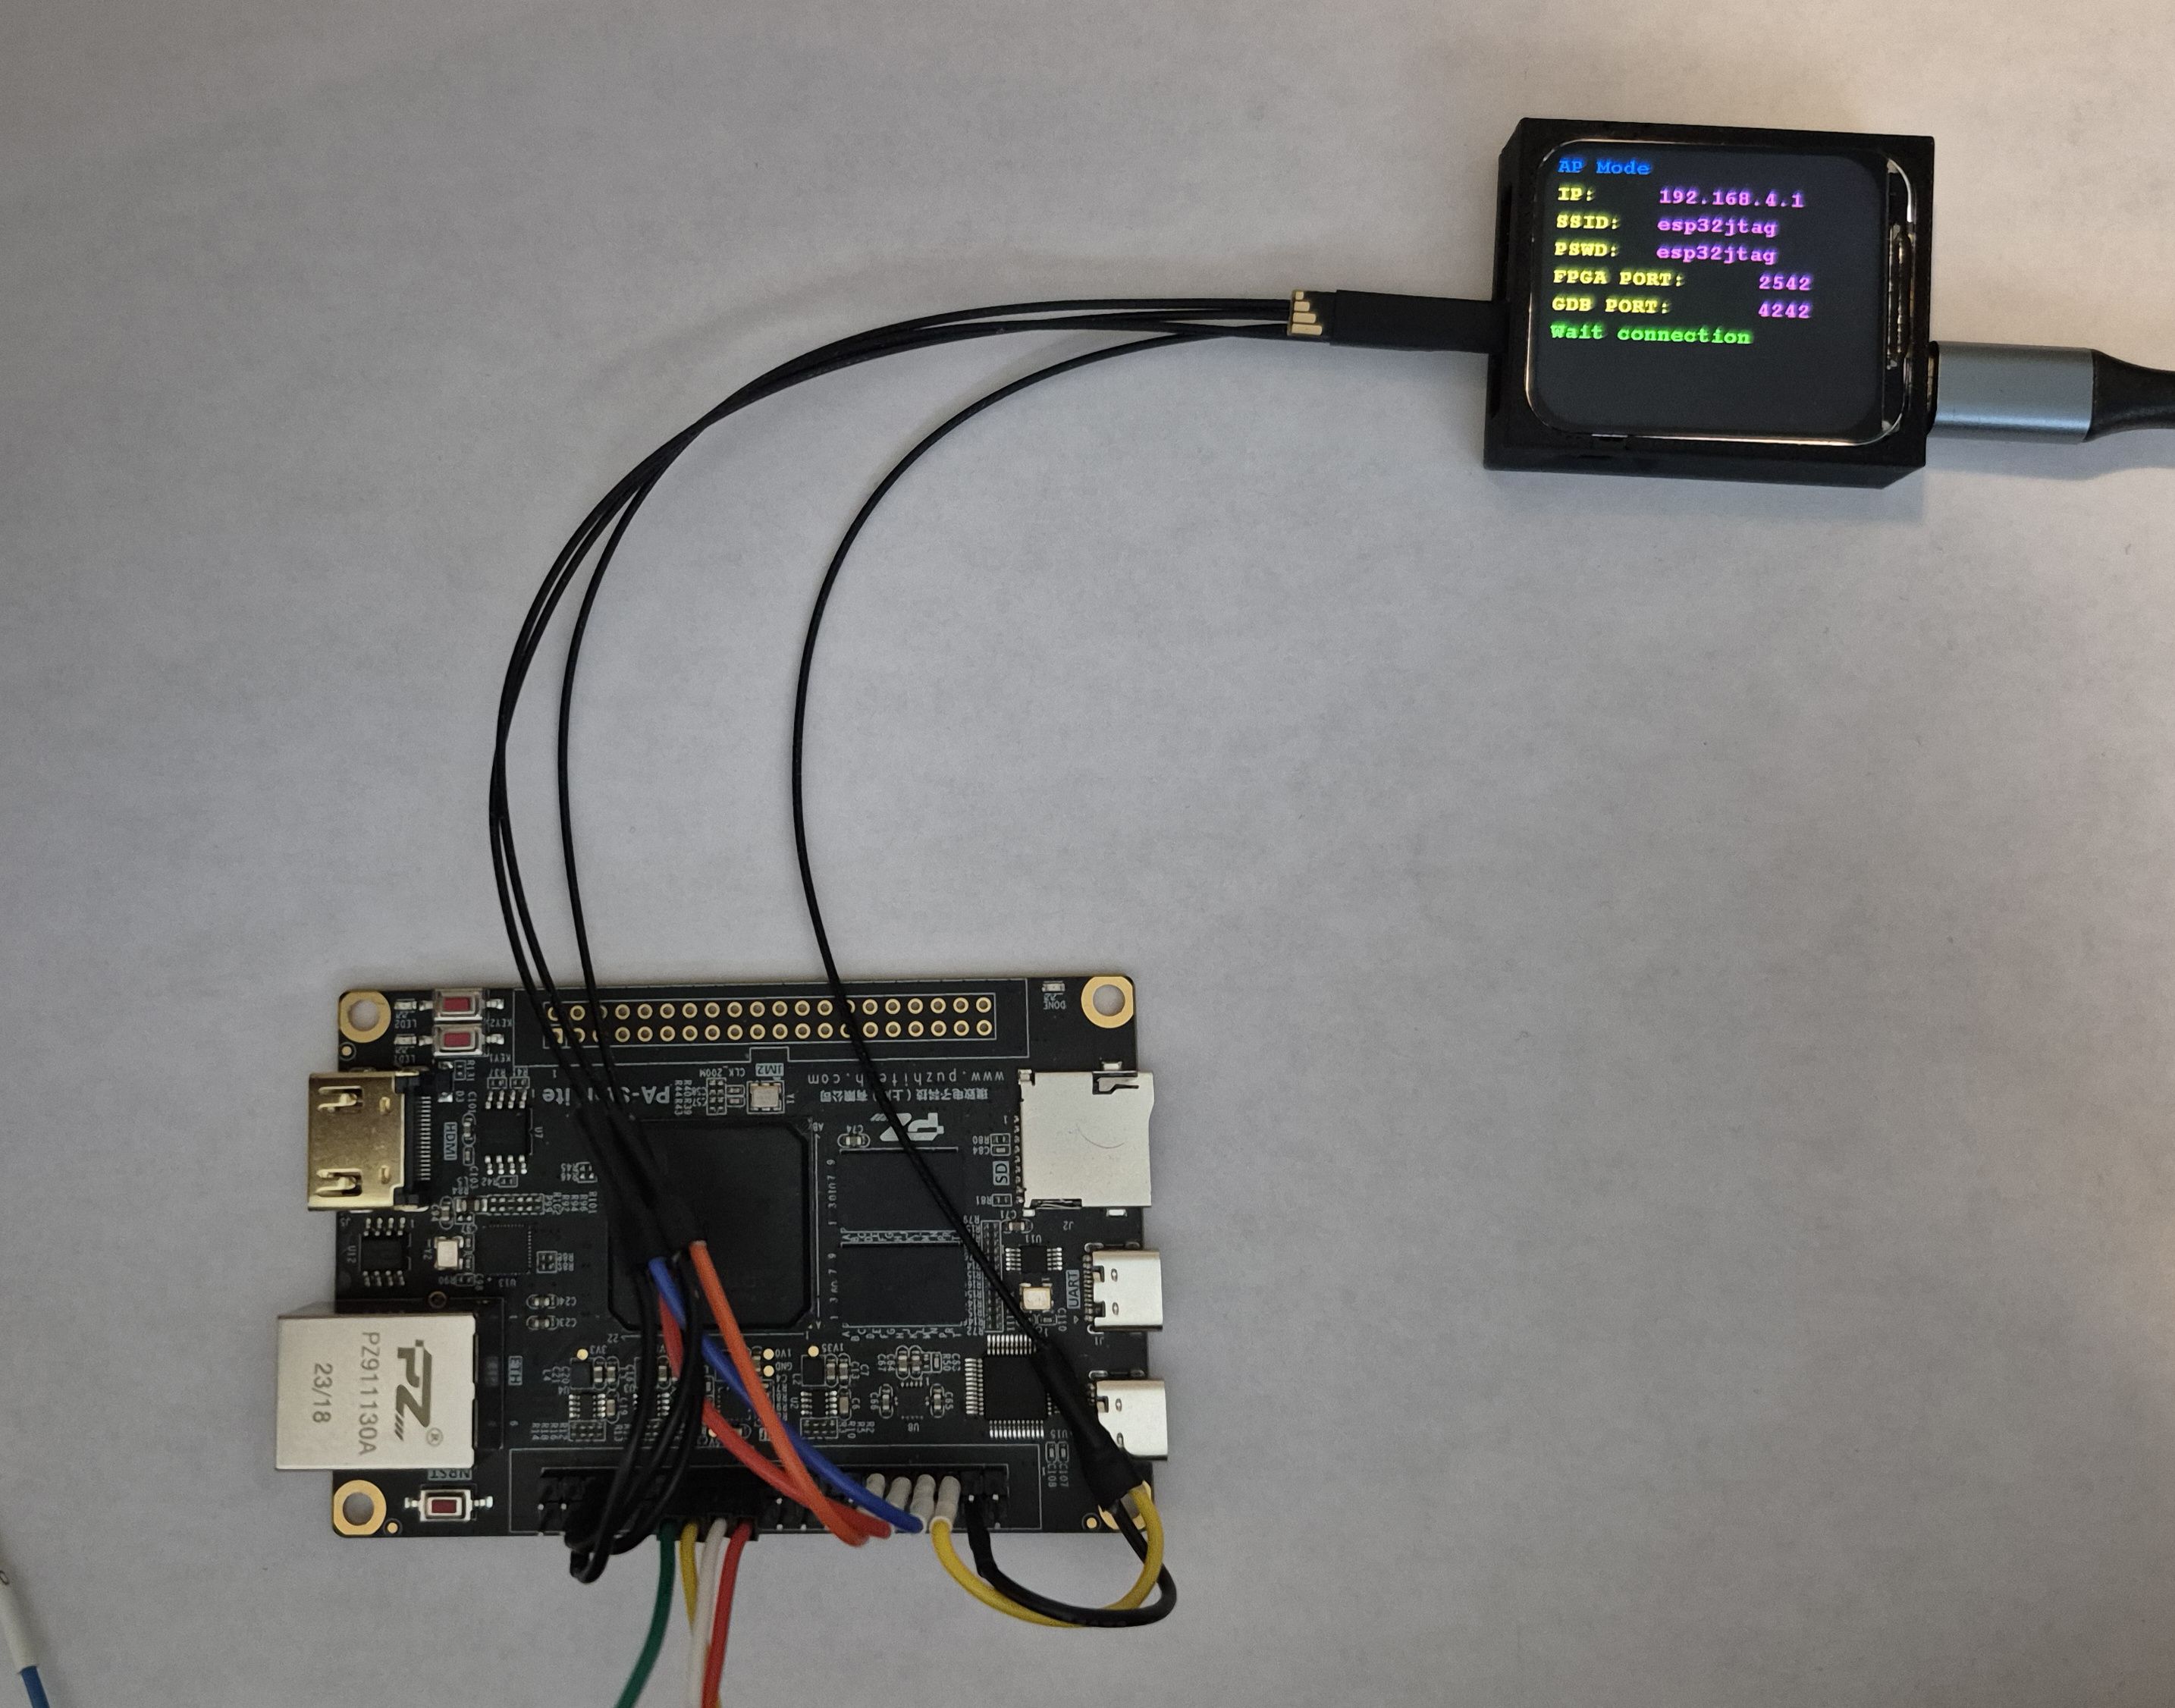
7.1 Real Hardware Setup
Now let’s set up the ESP32JTAG to connect to an Artix-7 FPGA board and capture real signals from it. In this example, we are using four channels on Port P3 of the ESP32JTAG. The FPGA outputs the following clock signals:
- 100 MHz
- 50 MHz
- 25 MHz
- 12.5 MHz
These signals will be captured and analyzed in the logic analyzer interface.
7.2 Capture and Results
The video below demonstrates capturing signals directly from the FPGA board:
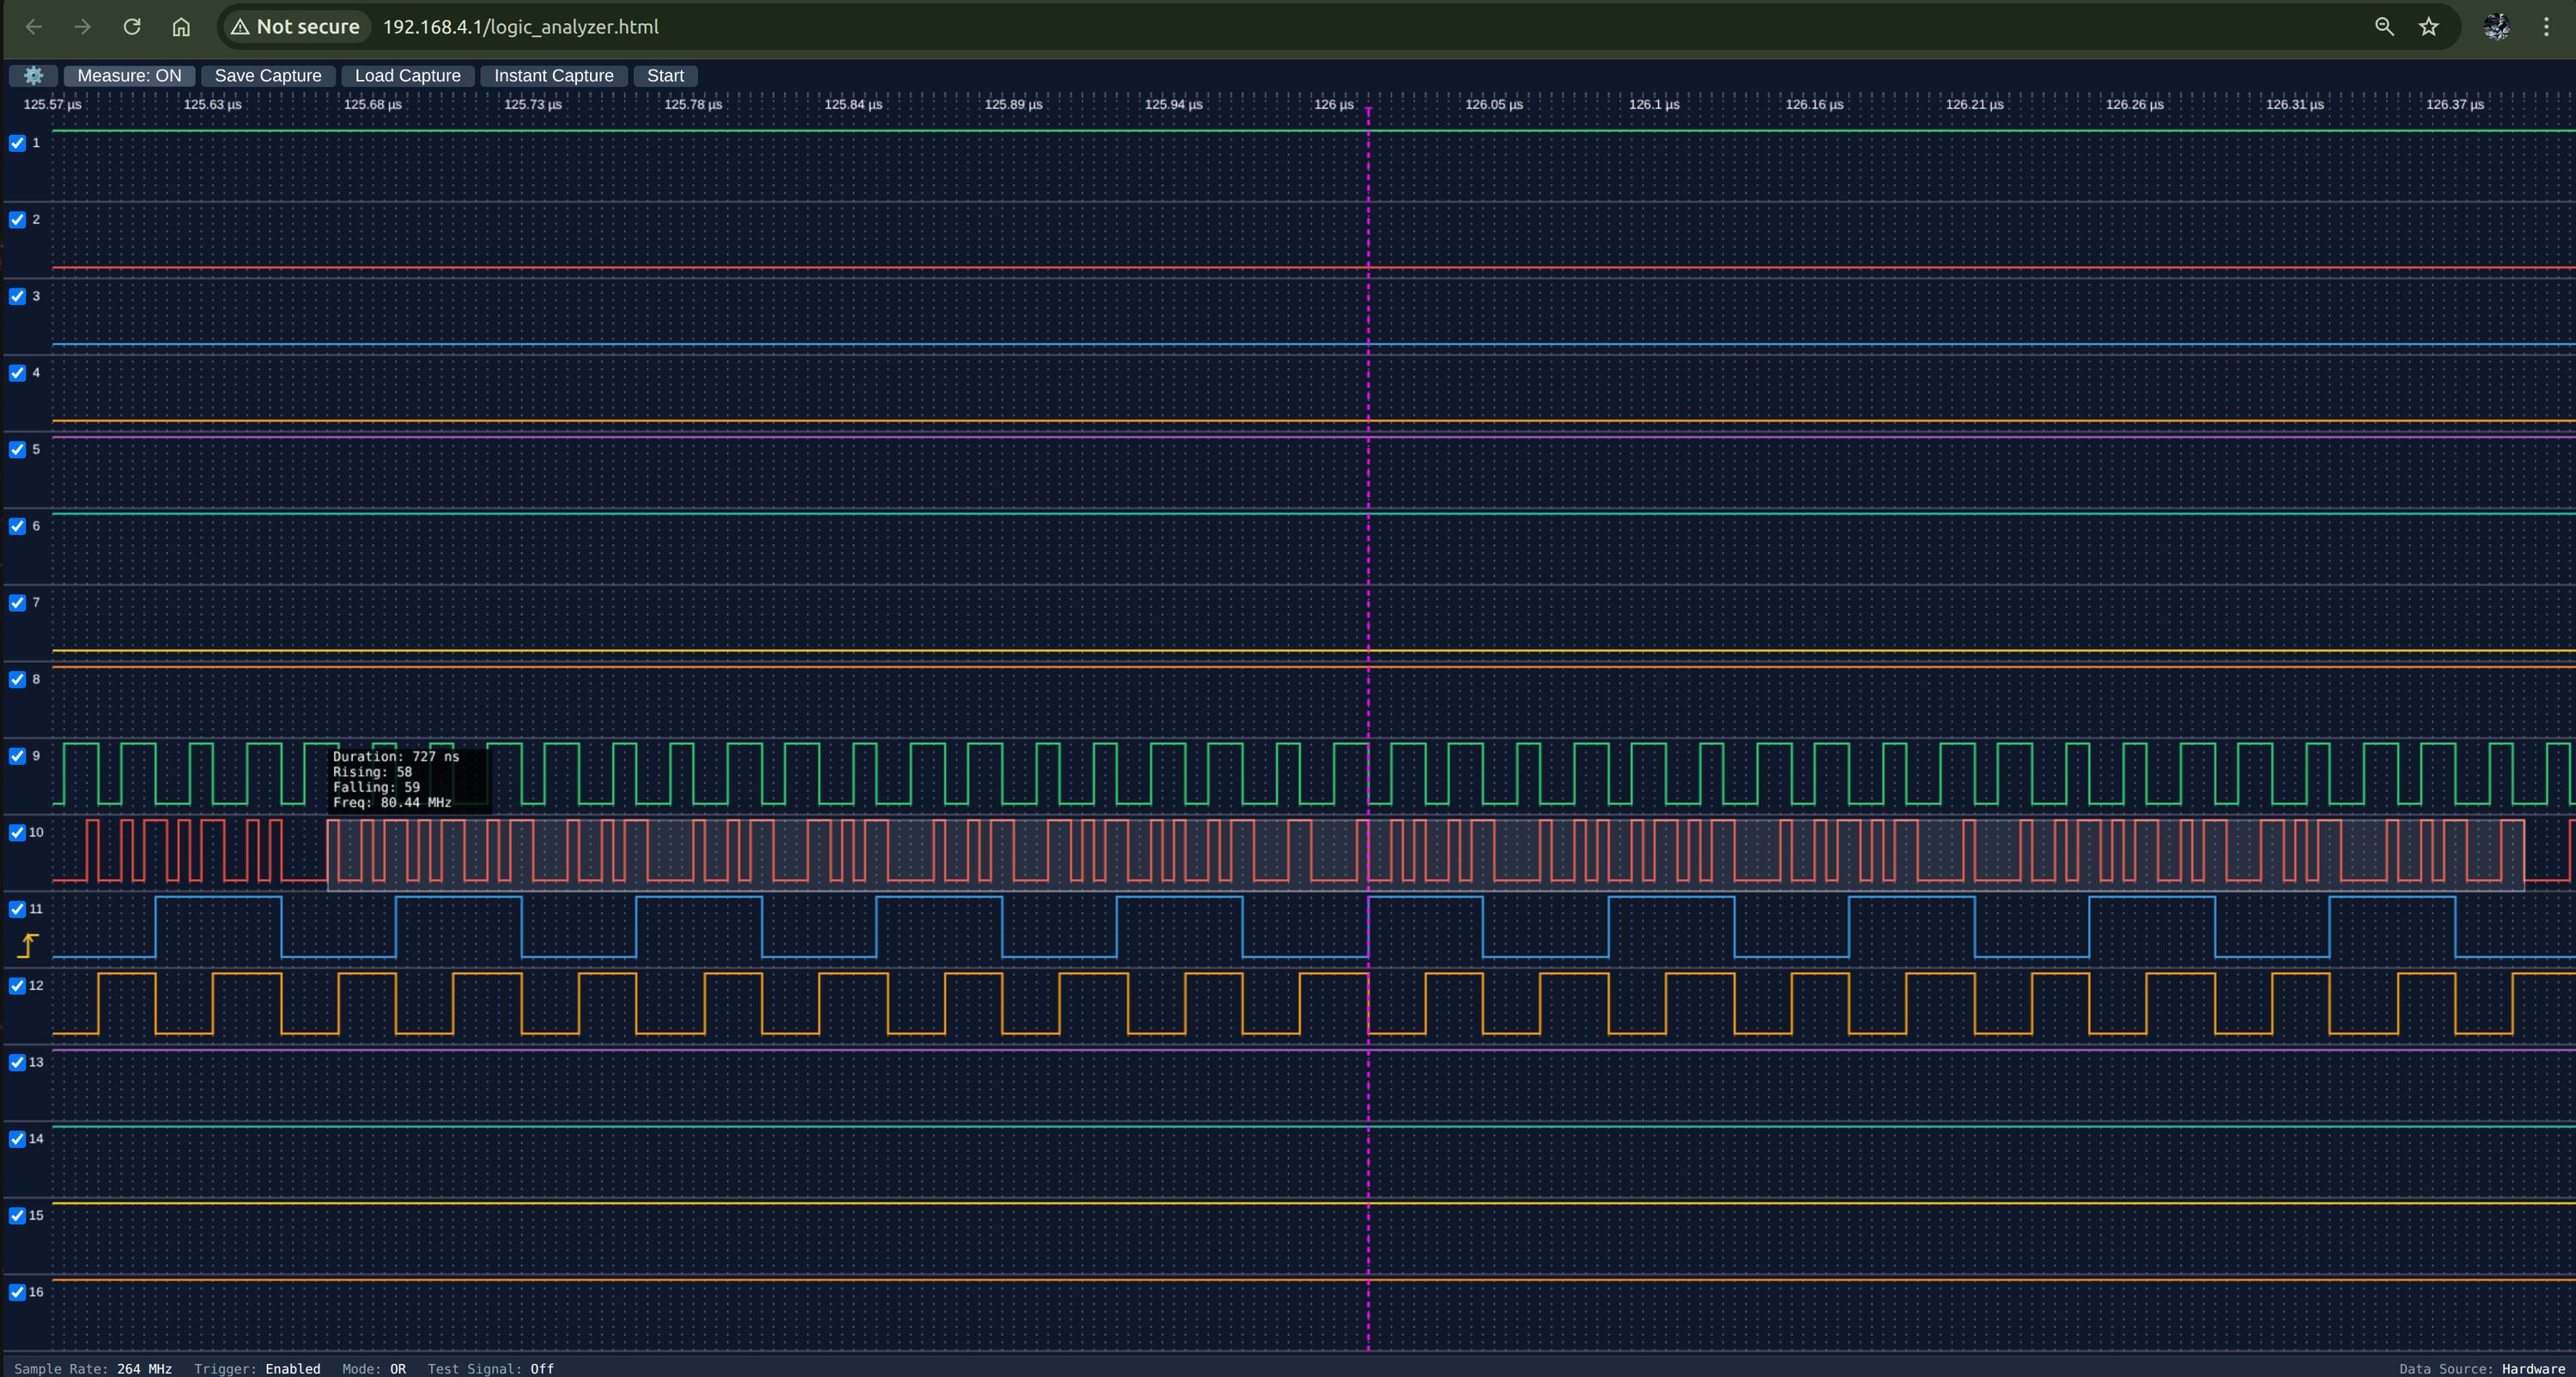
We can see the 50 MHz signals are captured cleanly, with no missing rising or falling edges.
The same applies to the 25 MHz and 12.5 MHz signals.
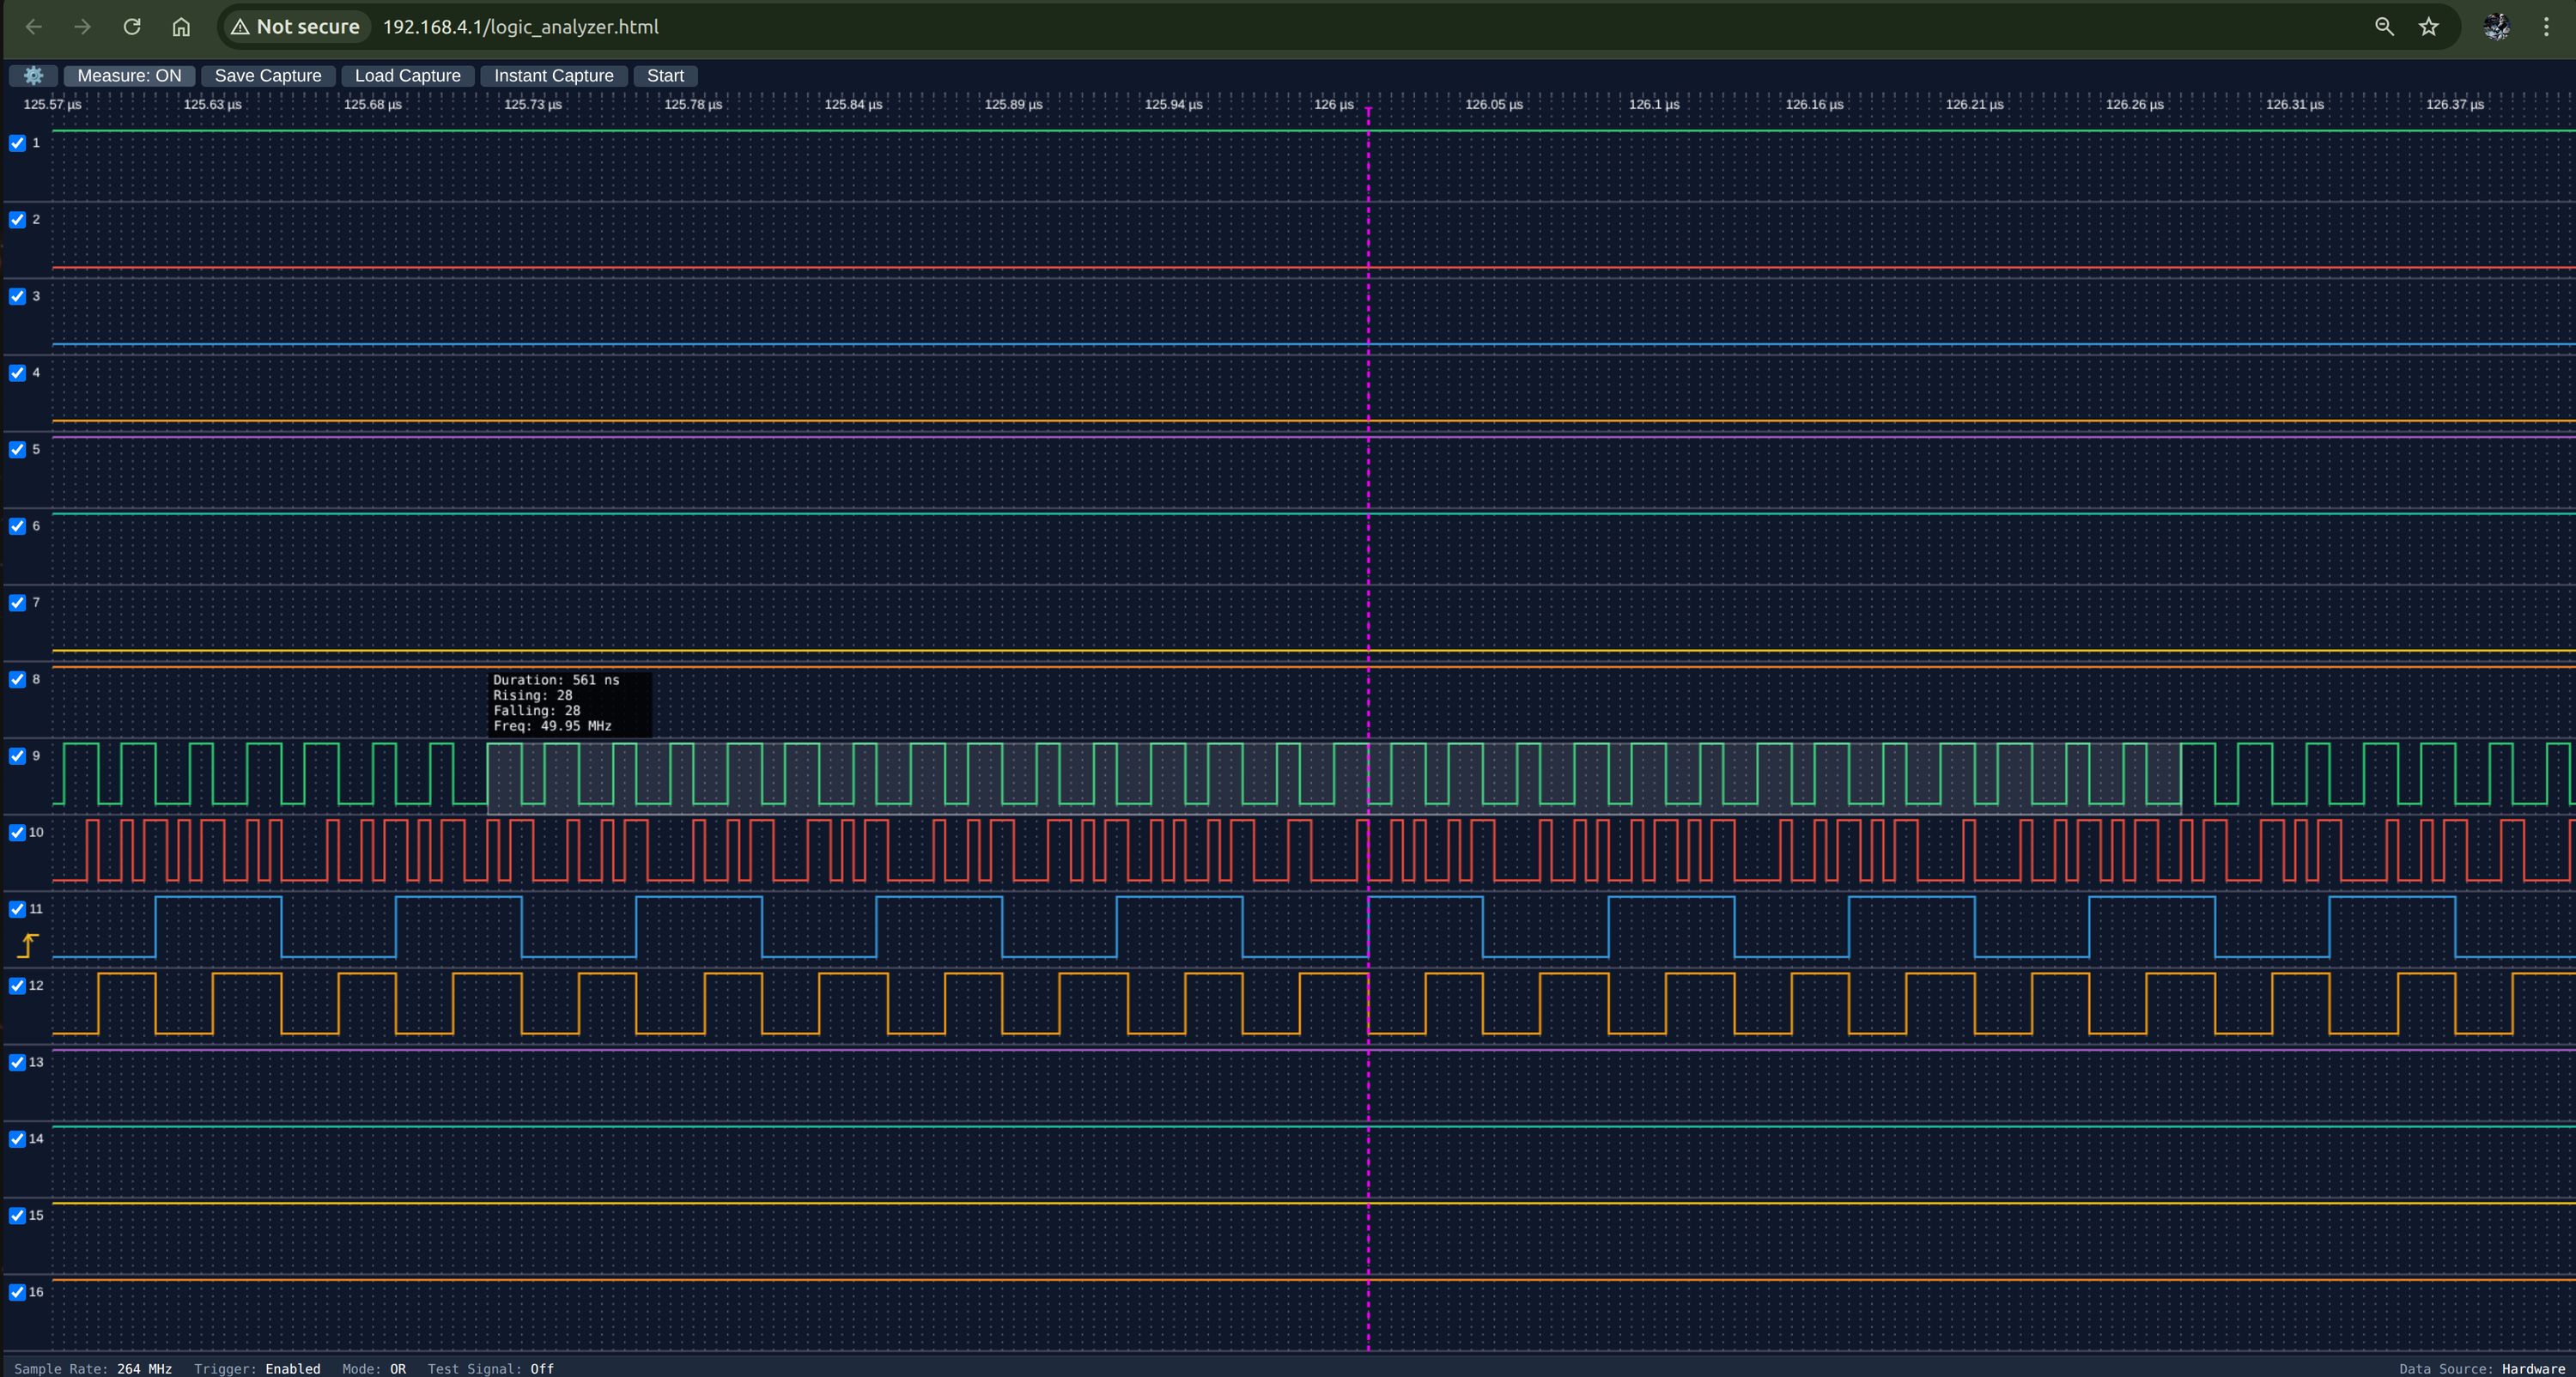
However, at 100 MHz, which is close to the limits of the 264 MHz sample rate, some edges begin to be missed:
Summary of Real-World Input Frequency Capability
- Reliable capture up to 50 MHz and more
- Usable but with edge loss: ≈ 100 MHz
- Therefore, the maximum practical input frequency is above 50 MHz but below 100 MHz.
For typical MCUs with clock speeds under 200 MHz, this performance is more than sufficient for debugging and signal inspection.
8. User Interface Overview
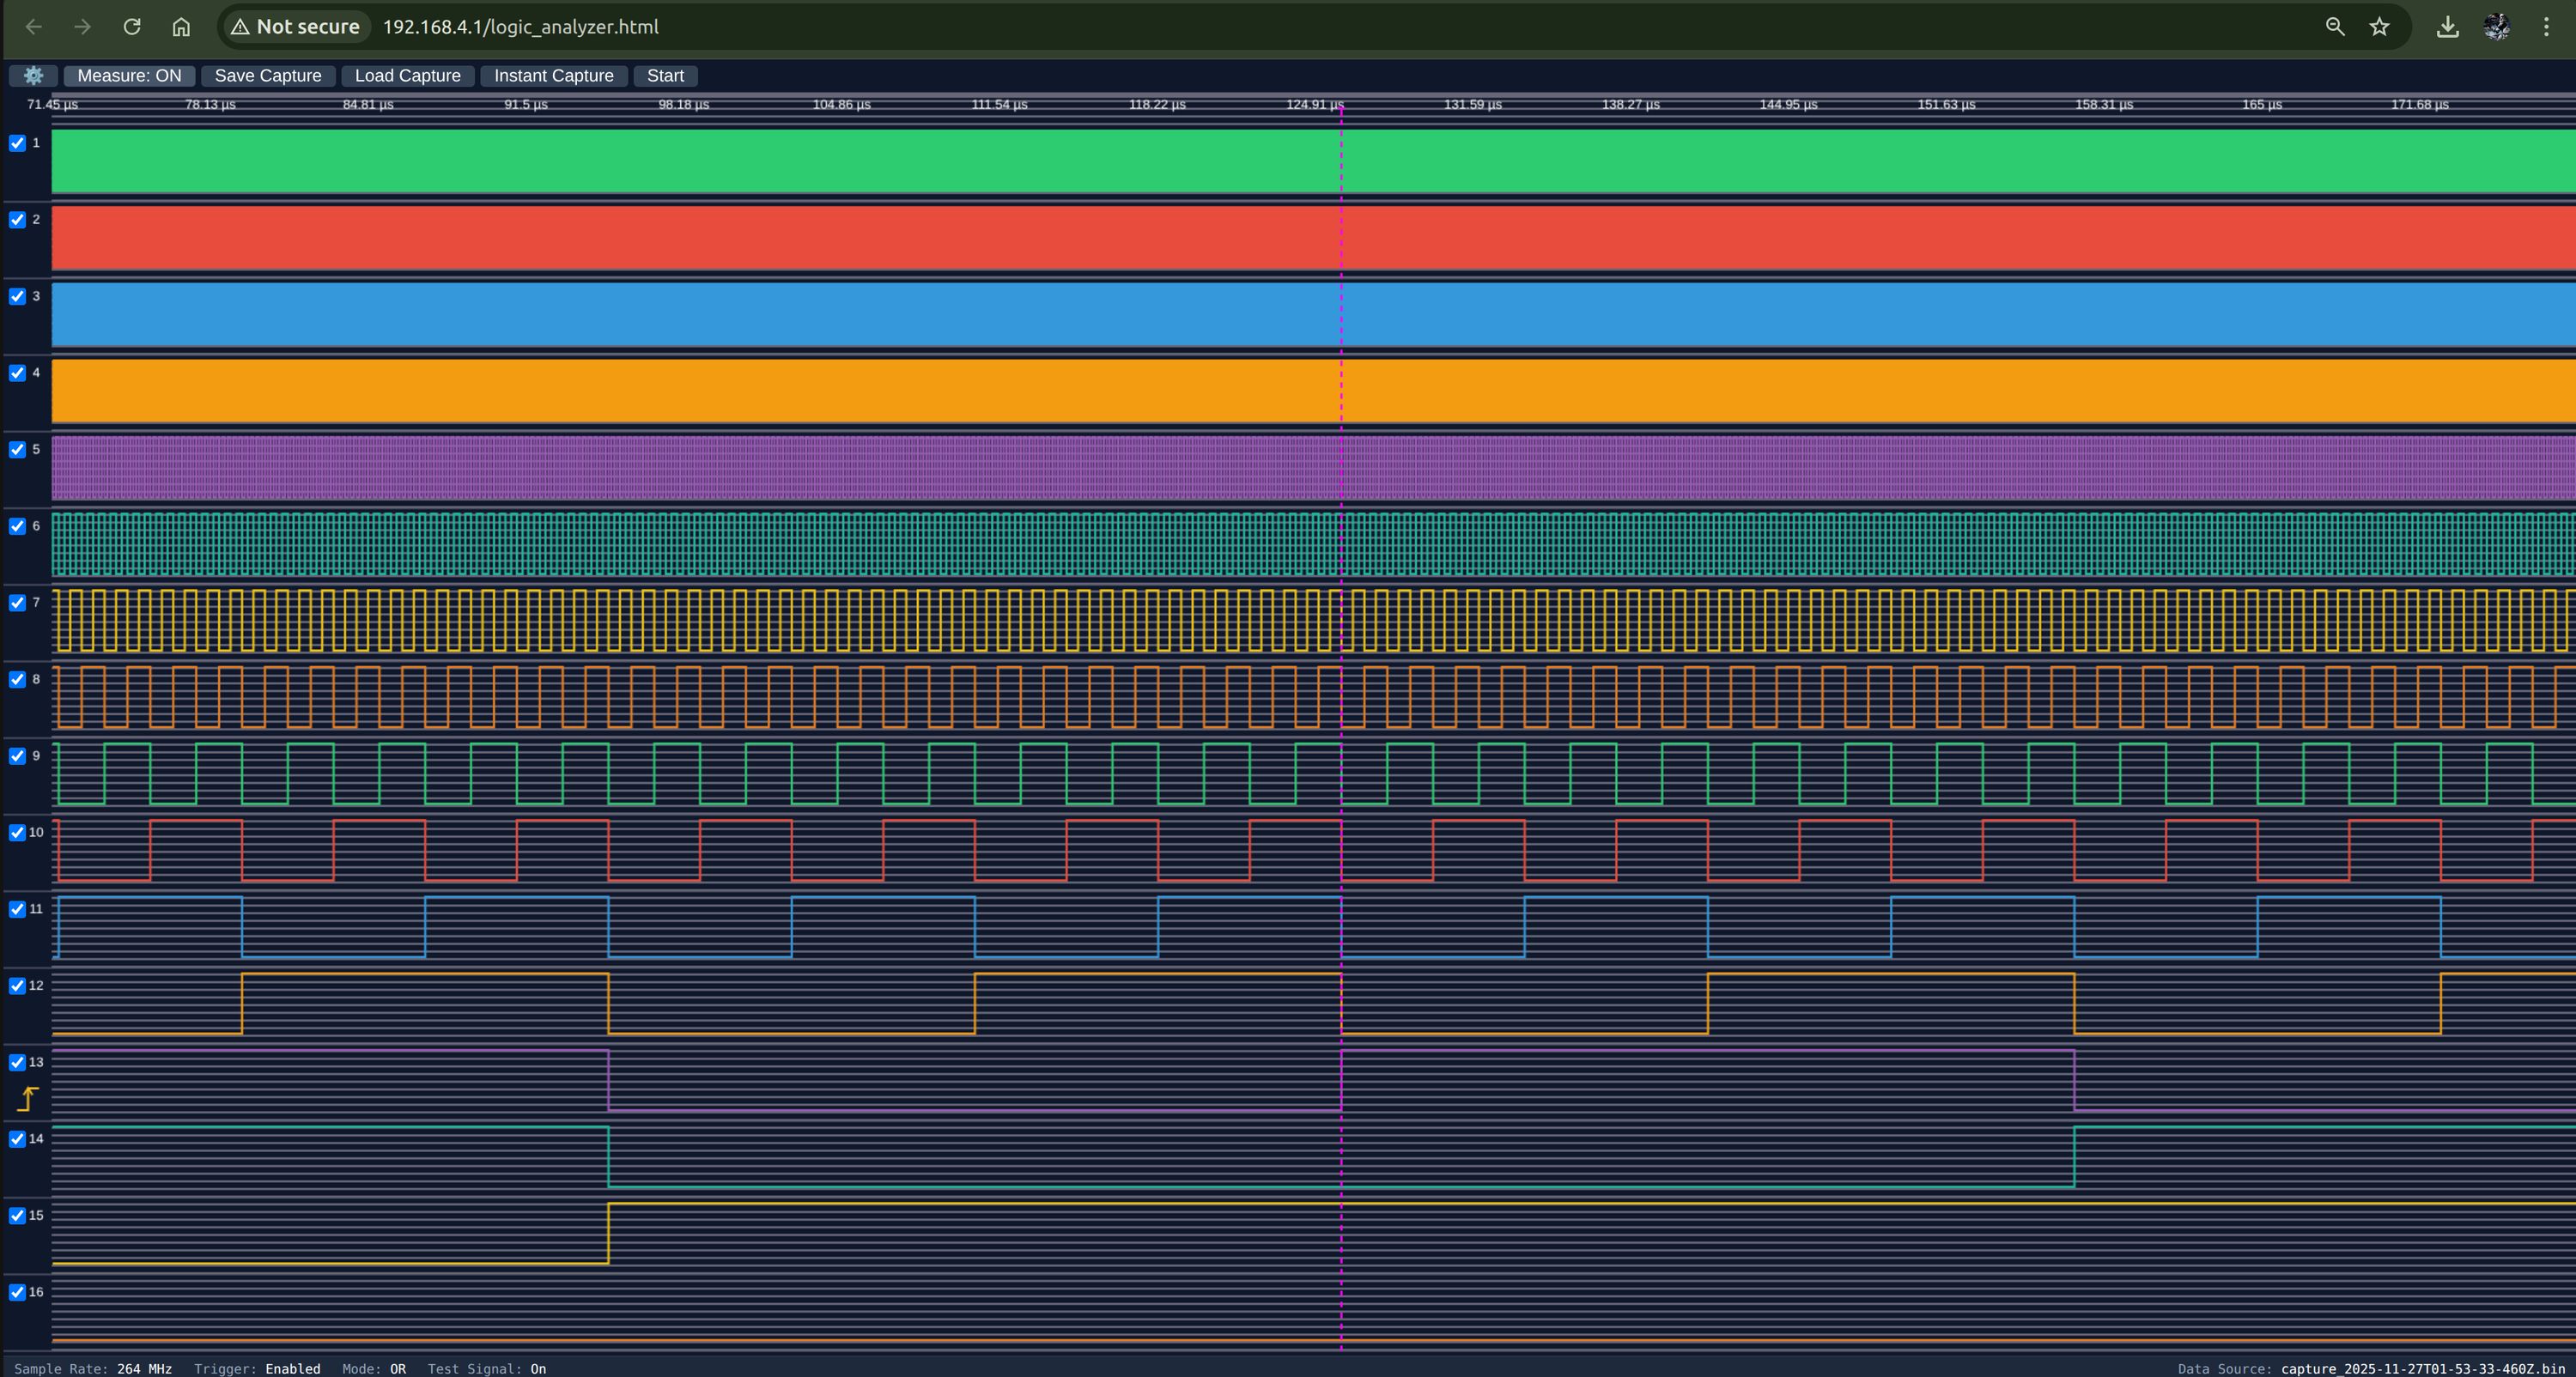
8.1 Top Controls
- Instant Capture
- Start
- Save Capture
- Load Capture
- Measure
- Settings
8.2 Per-Channel Options
Every channel allows:
- Custom name
- Custom color
- Individual trigger condition
8.3 Status Bar
The Status Bar displays the following data:
- Sample rate
- Trigger enabled/disabled
- Trigger mode (ALL/AND)
- Test signal ON/OFF
- Data source (Hardware or Saved File)
This keeps you aware of all active settings.
9. Future Plans
We have several features planned for upcoming releases:
- Sigrok support
- Protocol analyzers for SPI, I²C, UART, and more
- Waveform compression, allowing much longer captures—especially when signals remain unchanged for extended periods
- Additional enhancements based on your feedback
10. Summary
Your ESP32JTAG logic analyzer is completely ready for real-world use with:
- 264 MHz max sample rate for all 16 channels
- 16 independent channels
- Advanced trigger configuration
- Internal test signal generator
- Save/Load capture files
- Simple browser-based UI (no software installation)
It’s a powerful, flexible tool for embedded debugging and digital signal analysis.
If you have questions or want more examples, feel free to reach out to us on Crowd Supply.
Happy debugging!