Project update 2 of 4
10 GHz (3 cm) Amateur Radio Band Test Results
by Andrew Back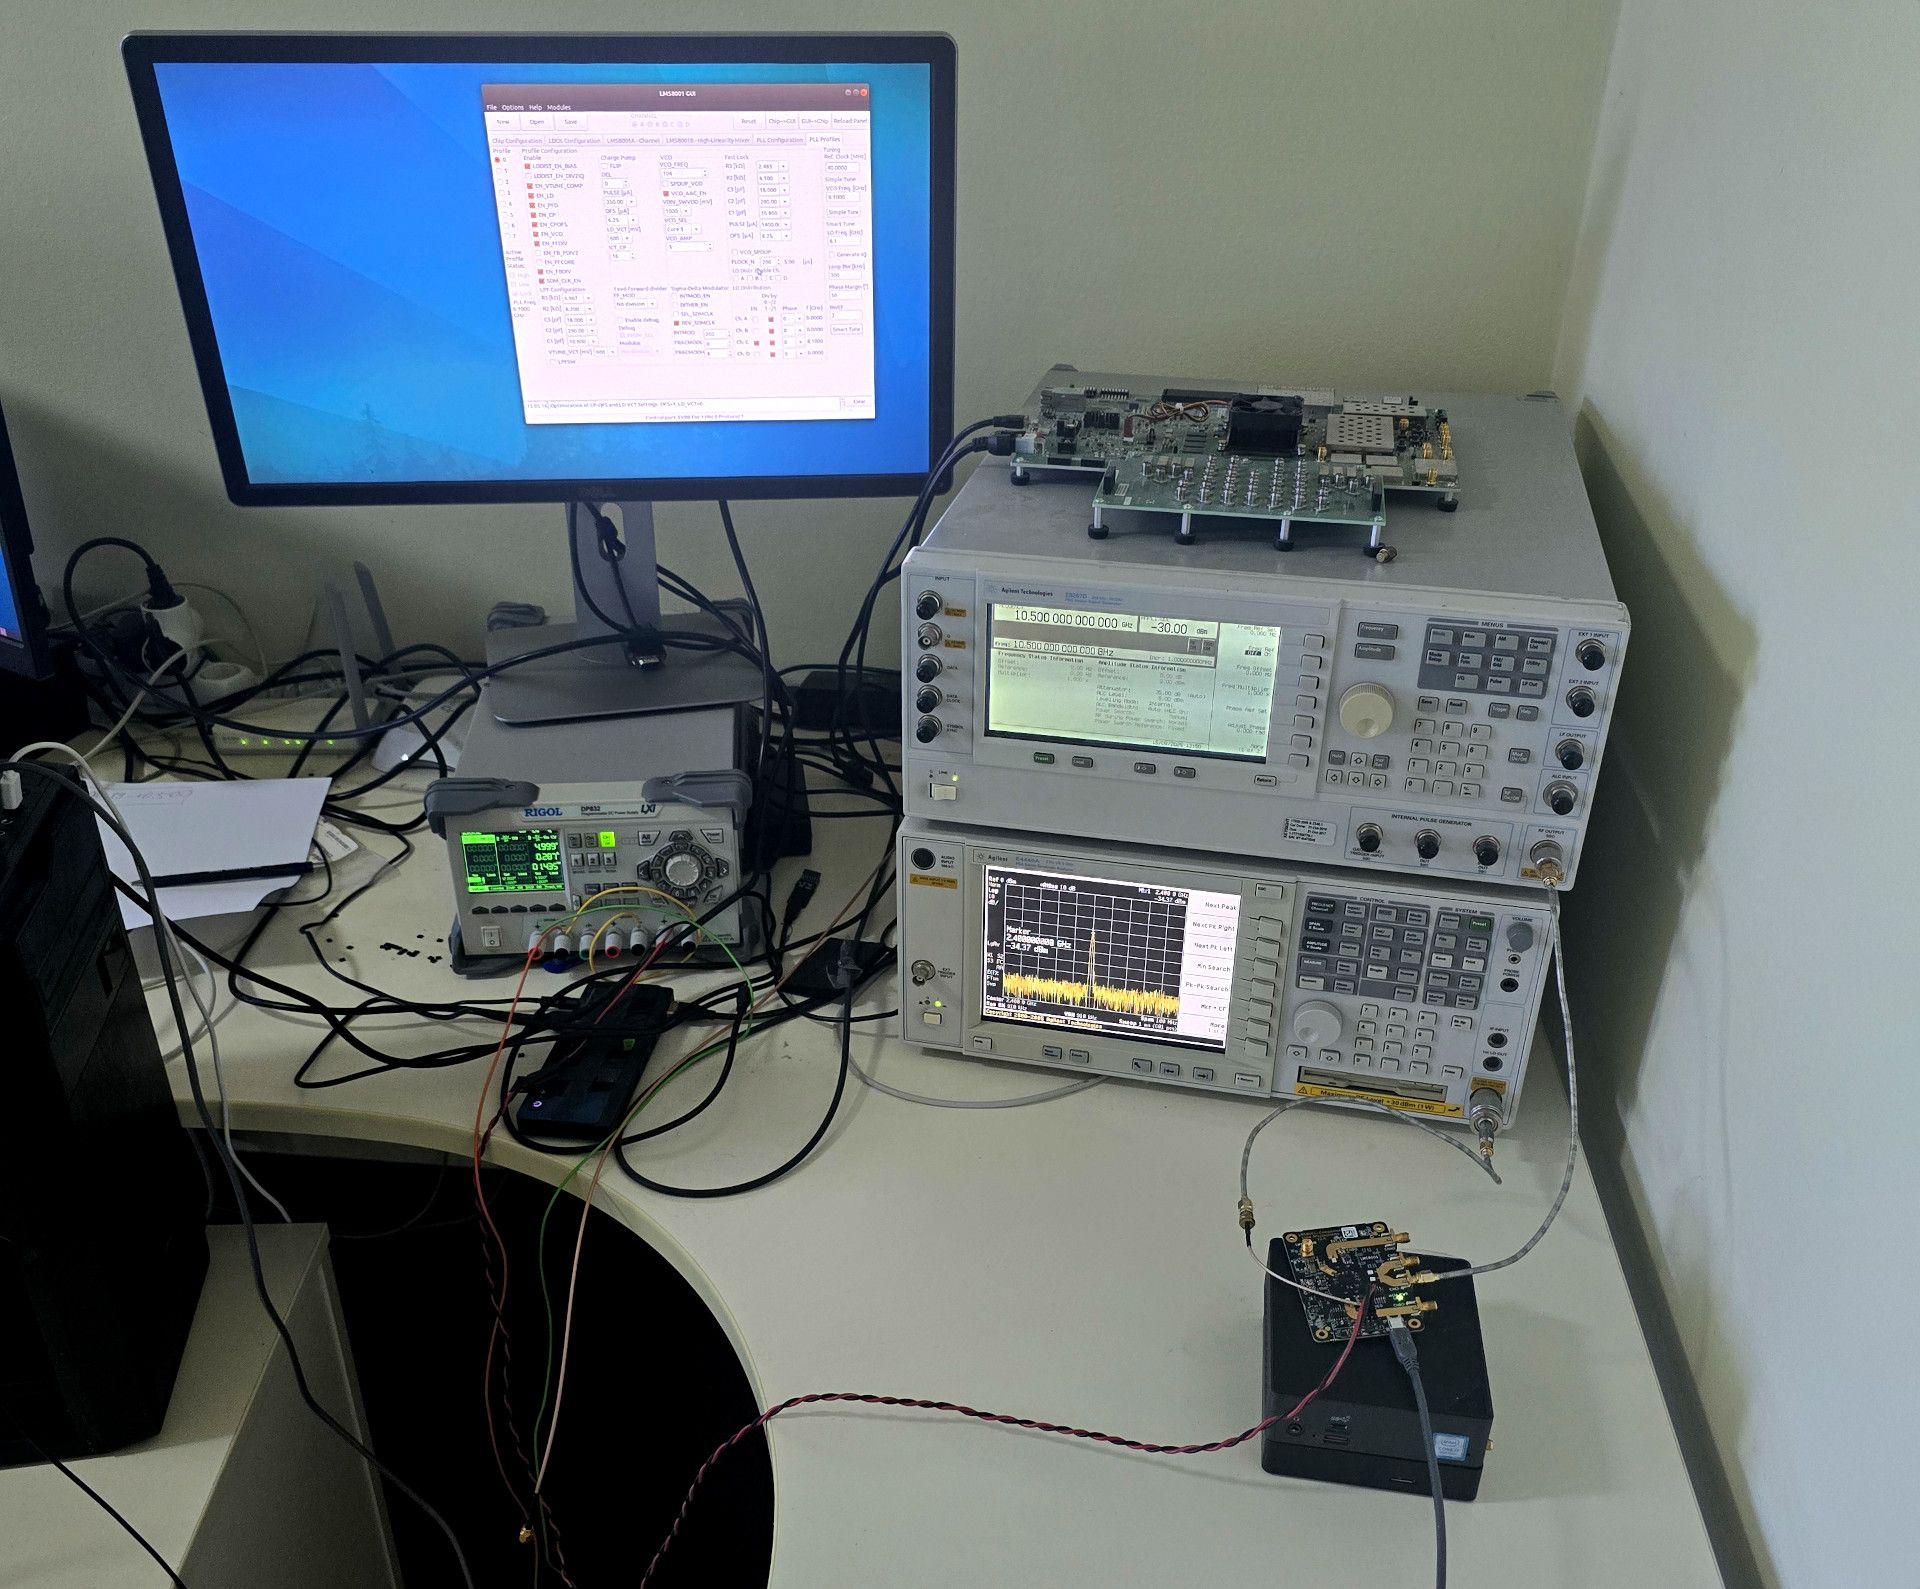
We are excited to share our performance measurements for the LMS8001 Companion Board operating in the 10 to 10.5 GHz frequency range, which covers the 3cm amateur radio band and has generated significant community interest. Applications for this band include:
- Terrestrial communications
- Satellite communications
- Earth-Moon-Earth (EME) -- a.k.a. "moon bounce" -- communications
- Narrowband, wideband, voice, data, and amateur TV modes
Measured Performance Results
Our testing confirms excellent performance across the 10-10.5 GHz band:
Table 1: Measured results for up and down conversion
| Up Conversion | Down Conversion | |||
|---|---|---|---|---|
| Min | Max | Min | Max | |
| Conversion Gain [dB] | -14.8 | -9.8 | 7.6 | 12.8 |
| Input IP3 [dBm] | 8.4 | 10.1 | 6.0 | 8.3 |
| Input P1dB [dBm] | 2.4 | 3.1 | -1.8 | 1.0 |
| NF [dB] | / | / | 12.0 | 16.2 |
Table 2: Measured results for phase noise when LO is set at 8 GHz
| Offset from carrier | @ 1kHz | @ 10 kHz | @ 100 kHz | @ 1 MHz | @ 10 MHz |
|---|---|---|---|---|---|
| Phase Noise [dBc/Hz] | -83.4 | -93.2 | -92.9 | -118.3 | -135.0 |
Phase Noise and Local Oscillator Specifications
In response to community questions regarding the phase noise performance for narrowband signal processing (such as 3 kHz SSB signals), we can provide the following technical details.
Local Oscillator Architecture
The LMS8001 Companion Board incorporates a high-stability 40 MHz VCTCXO (Voltage Controlled Temperature Compensated Crystal Oscillator) as its reference source, not a standard crystal oscillator. This choice provides several critical advantages:
- Temperature Compensation: VCTCXO technology provides superior frequency stability over temperature compared to standard crystal oscillators.
- Low Phase Noise: TCXOs typically achieve phase noise performance of -110 to -130 dBc/Hz at 1 kHz offset for frequencies in this range.
- External Reference Capability: The board includes provisions for locking the VCTCXO to an external high-stability reference for applications requiring even higher phase noise performance.
Frequency Synthesis
The LMS8001A IC incorporates an integrated PLL (Phase-Locked Loop) with programmable local oscillator distribution. The PLL operates with full performance up to 8.3 GHz and with relatively small degradation up to 9.2 GHz. For the 10–10.5 GHz operation demonstrated here, the measured performance shows it remains suitable for many applications.
Phase Noise Considerations for Narrowband Applications
For narrow bandwidth signals such as 3 kHz SSB:
- The VCTCXO reference provides inherently better phase noise than standard crystals.
- The integrated PLL design minimizes additional phase noise contribution.
- External reference capability allows connection of ultra-low noise references for the most demanding applications.
- Typical VCTCXO phase noise at 10 Hz offset: better than -80 dBc/Hz.
- Typical VCTCXO phase noise at 1 kHz offset: better than -130 dBc/Hz.
Measurement Setup and Detailed Results
Upconversion
The measurement setup consists of:
- Signal generator, which generates a signal at IF frequency of 2.4 GHz
- The LMS8001 Companion Board, where channel A is used to up convert from 2.4 GHz to the signal at RF frequency range of 10-10.5 GHz
- Spectrum analyzer, which is set to scan spectrum in RF frequency range of 10-10.5 GHz
The results below show gain, input IP3, and input P1dB versus RF frequency.


Downconversion
The measurement setup consists of:
- Signal generator which, generates a signal at RF frequency range of 10-10.5 GHz
- The LMS8001 Companion Board, where channel C is used to down convert the signal from RF frequency range of 10-10.5 GHz to the signal at IF frequency of 2.4 GHz
- Spectrum analyzer, which is set to scan spectrum at IF frequency of 2.4 GHz
The results below show gain, input IP3, NF, and input P1dB versus RF frequency


LO Phase Noise
The measurement setup consists of:
- The LMS8001 Companion Board, which generates LO signal at 8 GHz. (For IF frequency of 2.4 GHz and RF frequency range of 10 – 10.5 GHz, LO frequency should be set 7.6 – 8.1 GHz, we measured one point, and its results were shown in figure below.)
- Spectrum analyzer, which was set to measure power of the noise
