Project update 17 of 27
Packetry: Building a High Performance Protocol Analysis Tool
by Martin LIn a previous update, we introduced our work on Packetry, our new front-end software for using Cynthion to capture and analyze USB traffic on the wire. In this update, we’re going to talk a bit more about the design of that software and explain some of the work we’re doing to make it as fast and easy to use as possible.
The need for speed
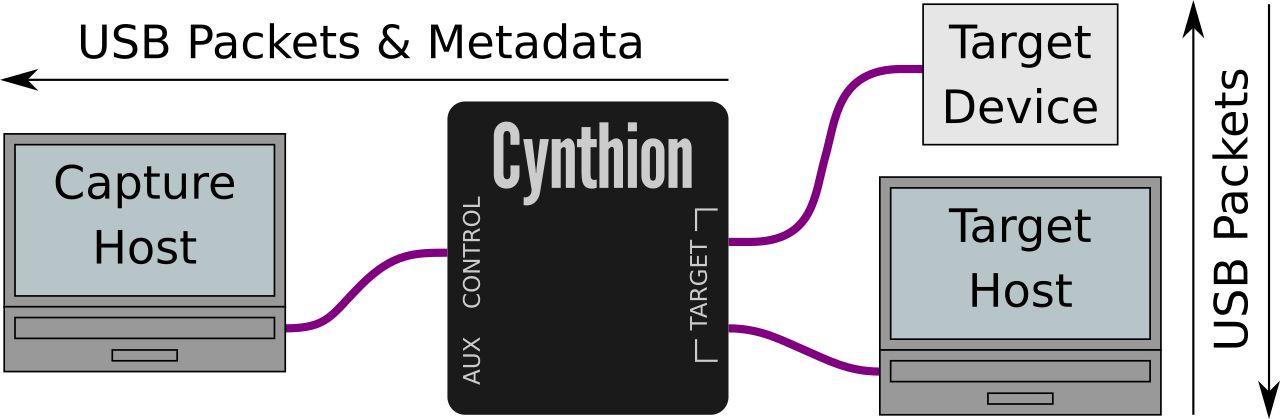
One of the most exciting features of Cynthion is its ability to serve as a protocol analyzer, letting you intercept and capture USB traffic on the wire, in the field, from real devices.
Fully benefiting from this feature requires the help of some very efficient software on the capture host. A high-speed USB capture, including metadata, can generate over half a gigabit per second of raw data. To see what’s happening in real time as the capture progresses, all that data needs to be processed at least as fast as it’s captured, which is close to 50 megabytes per second.
In fact, real-time performance isn’t really enough in practice. When opening a saved capture from a file, the software needs to process packets many times faster than real time. At real-time decoding speed, a busy minute-long capture would also take a whole minute to load. So we need a solution that can process USB packet data many times faster than real-time speeds, which means a throughput of hundreds of megabytes per second at least.
Because of these requirements, we’ve designed Packetry from the ground up to achieve the fastest possible decoding speeds and to scale seamlessly to captures of unlimited size, bounded only by disk space. We’re also thinking ahead: Packetry has been developed for USB 2.0 analysis with Cynthion, but in the future we may want to use it to analyze higher speed protocols.
All these factors have made performance critical to success: so how did we achieve it?
Laziness as a virtue
To achieve the speed and scalability we need, we must do the minimum work necessary for each packet at capture time. We don’t need to fully interpret all traffic as it’s captured: we just need to follow each packet’s effect on the protocol and store things in a form we can efficiently access later.
Rather than constructing individual data structures to represent packets, transactions and other protocol elements, we simply write all captured packets out into a flat bytestream in order. In this form, the capture can be very efficiently written to a file as it progresses.
As we do so, we build a set of indexes which describe where to find the start of each packet, the start of each transaction, and so forth. Those indexes are how we describe the protocol structure. They are designed to provide just enough information for the UI to later look up any part of the capture, decode it on demand, and display it.
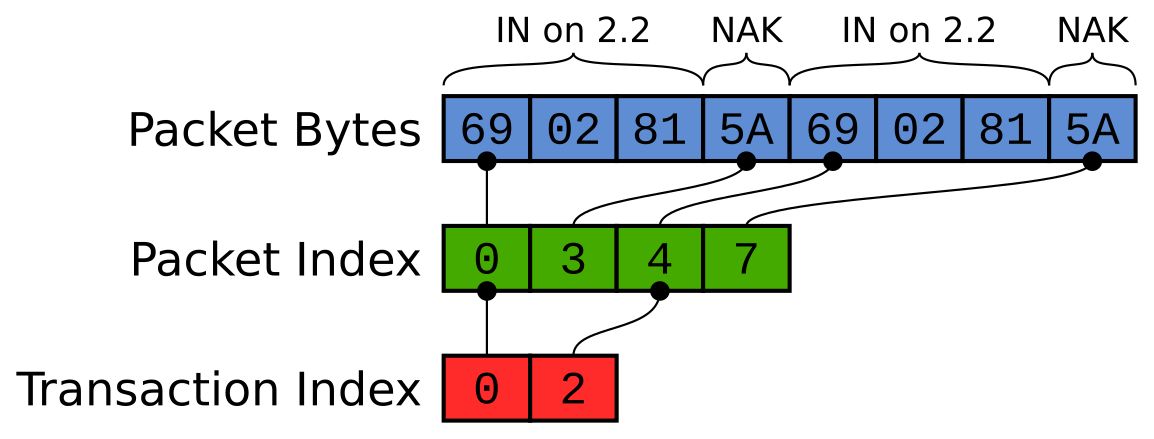
Each index is a monotonically increasing sequence of integers. Because of that, we can store them very efficiently. We use a simple compression scheme to minimize the storage overhead of the indexes. To ensure scalability, these indexes are also streamed to files themselves. As such, capture size is limited only by available storage, never by available memory. All data structures in memory have a bounded size which is independent of the size of the capture.
In this approach, we gain scalability by giving up a little speed at display time. This is a good tradeoff to make, because, unlike capturing or loading data which may happen at extremely high speeds, displaying data is constrained by the bandwidth of the human user. There can only be so many things on screen at once, and the user can only browse through them at human speeds. We do not have to make rendering the display very fast for it to feel instantaneous.
Traffic display
USB is a highly structured protocol: packets are grouped into transactions, transactions into transfers, and transfers are attached to specific endpoints on devices. Our UI displays traffic hierarchically according to that structure, making captures easy to understand and explore. A similar design approach was pioneered in ViewSB, but in Packetry we’ve now made it fast and scalable to large high-speed captures.
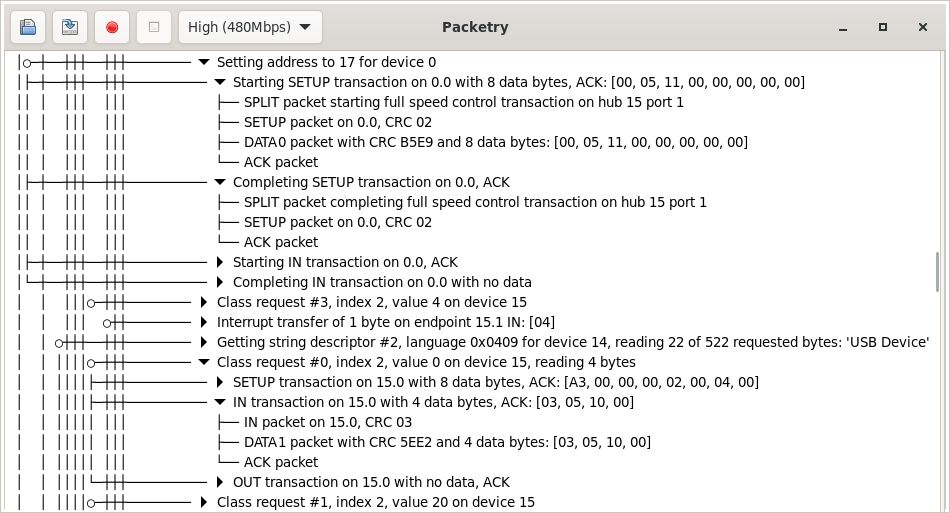
Our GUI has been built on GTK 4, which has built-in support for displaying large lists and trees by lazily loading only the parts currently visible on screen, recycling UI widgets for efficiency, and preloading ahead of scrolling. When you scroll through the traffic view in Packetry, the packets required are loaded on demand using the capture indexes, decoded on the fly, and used to generate the summaries you see of packets, transactions and transfers. All this happens live, too: if you’re running a capture, you’ll see new traffic appear, and the descriptions of existing items may be updated as further packets come in. When you load a capture from a file, you can start exploring it immediately, even while the packets later in the file are still being indexed.
Threading model
It’s been a while since individual CPU cores got significantly faster; these days performance gains usually come from parallelization to take advantage of multiple cores. However, some tasks just can’t be parallelized, and the only option is to make them as fast as possible on a single thread.
When analyzing packets captured on the wire, every packet matters to the overall state of the protocol. The need to deal with invalid packets and protocol errors means it’s not possible to make assumptions about structure. Interpreting traffic correctly requires looking at every packet one by one, in order, and updating the protocol state at each step. That means our packet decoder has to run as a single thread and be highly optimized for throughput.
We can, however, move everything else out to separate threads so that the core decoder can run as fast as possible. Packetry runs as three threads, each feeding data to the next:
The capture thread deals with streaming captured packets from a Cynthion device over USB.
The decoder thread processes captured packets, stores them and builds the capture indexes.
The UI thread runs the user interface, reading from the indexes and stored packets to display the captured traffic in a human-readable view.
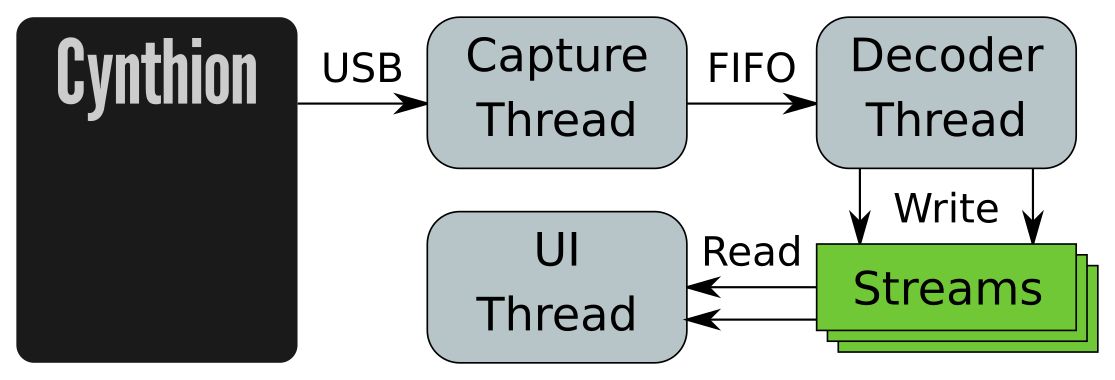
A key feature of the design is that all the interactions between these three threads are lock-free: they cannot block each other. The capture thread supplies packets to the decoder thread through a FIFO queue. The decoder and UI threads use our own lock-free stream implementation, which allows a single writer and any number of reader threads to efficiently share a growing data stream whilst it is being buffered and written out to storage, then mapped back into memory as needed.
Keeping these threads decoupled from each other helps us ensure that capture will always continue to run at a consistent throughput, no matter how complex the the traffic is or what analysis is being done in the UI.
Head to head
So how fast is it? To give a quick illustration, here’s Packetry and Wireshark loading the same file, side by side. The file is a 300MB capture in pcap format of a HackRF in use.
Packetry finishes loading the file 10x faster — but you don’t even need to wait for that to happen to start exploring the capture. The view is ready to interact with as soon as the first packets are decoded. That happens almost instantly, and you’re up and running immediately with a fully hierarchical, human-readable view of the traffic.
Trying it out
Packetry is still in active development and we don’t have releases or binary downloads yet. If you’re really keen to play with Packetry you can build it from source and try it out with the example capture files that are included in the repository for testing. Build instructions are in the repository.