Project update 3 of 17
Heart-rate vs. Heart-rate Variability (HRV)
Heart rate is the data you get from a regular heart rate monitor like a chest-worn belt or a wrist-worn band based on optical sensors. The heart rate computed by these devices is an averaged value of the R-R intervals (explained in the main page) calculated over a period of time.
HeartyPatch, on the other hand, keeps track of each individual heartbeat to measure the precise time between beats to arrive at what is known as heart-rate variability or HRV, for short.
Here is what an HRV tachogram plot looks like:
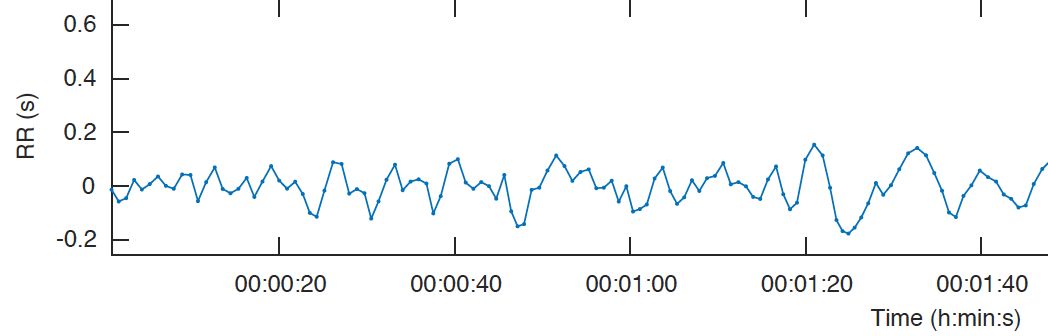
What’s seen here is a plot of R-R intervals against time, taken from a HeartyPatch. It can be seen that there is a pattern in regular heartbeat, but that pattern doesn’t always remain the same. There can be several reasons behind the plot variability.
A Poincare plot is a plot to quantify self-similarity in periodic events, in this case R-R intervals. In simpler words, it shows the difference between the current R-R intervals and the previous one.
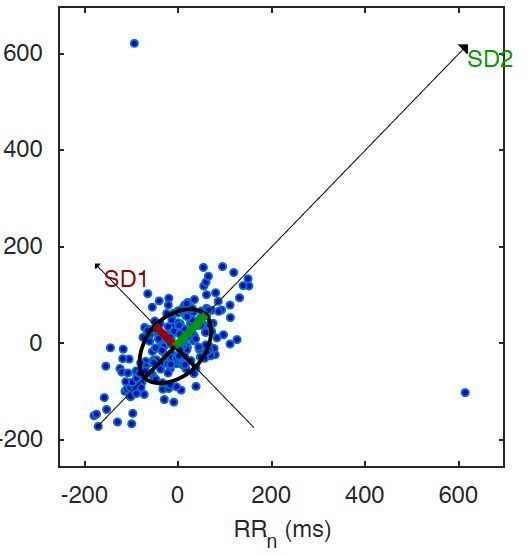
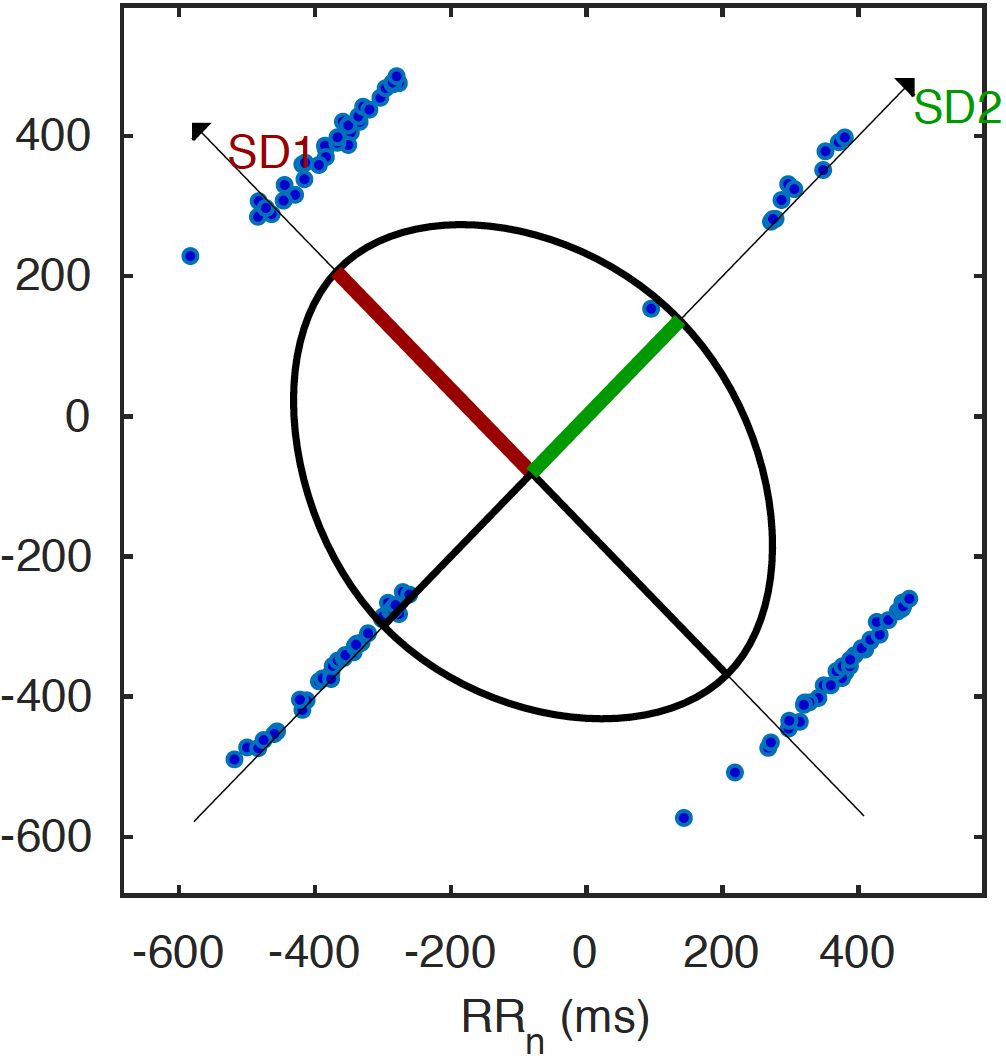
Interpreting this plot is simple: there are a bunch of points that are quite close to each other, meaning that there is a known pattern in the variability. Too many outliers outside of the concentration of points could mean a certain condition or an abnormality. For example, below is a plot for a specific type of Arrhythmia, simulated by an Arrhythmia simulator connected to the HeartyPatch.
By detecting these patterns in the similarity of the R-R intervals, it is possible to quantify certain parameters that can, in turn, be used to detect an event. These are just the basic methods for time-domain analysis, but there are several other frequency-domain results that can be obtained. HeartyPatch is an ongoing project and new methods will continue to be added.
Heart rate variability, has been known to indirectly reflect functioning of the autonomous nervous system, among other things. There have been several detailed studies about HRV and its interpretation for use in a wide variety of applications. Some of the most prominent ones are:
- The most obvious - cardiac function and arrhythmia detection. Variation in heartrate and the amount of variance in the heartrate directly corresponds to the Heart rhythm and abnormal rhythms can be detected by algorithms. More information about our studies on this will be published in a future update.
- Mental stress analysis: The two branches of the autonomic nervous system: the sympathetic and the parasympathetic, constantly interact with each other. When a stress event occurs, there is a temporary increase/decrease in blood pressure which leads to a temporary increase/decrease in heartrate, which is reflected in HRV. Check out the reference: for more details. Funcionality to quantify stress will be added to HeartyPatch soon.
- Detection of emotional state: Studies have shown that a person's emotional state (such happiness, fear, etc.) can be detected from studying HRV. This is specifically useful for evaluation of mental states in persons with intellectual disabilities such as autism, who does not express emotions in the way a normal person would. Read more about this at here.
- Several more applications of heart-rate variability have been identified that range from analysis of ANS (Autonomic Nervous System) dysfunction to even diagnosis of the progression of diseases and conditions such as Alzheimer's, diabetes, stroke and epilepsy. Once you understand the basics of how the ANS function is reflected in heartrate, there is no limit as to what applications can be built around this technology.
How does HeartyPatch help?
Traditional devices rely on software algorithms to detect R peaks in the ECG signal, this limits the accuracy of the intervals between R peaks due to processing speed, latency and so on. The primary differentiating component in HeartyPatch is the MAX30003 chip from Maxim. However, the MAX30003 AFE used in the HeartyPatch has a built-in R-R detection algorithm using the popular Pan-Tompkins method. We have measured this to be very precise, on the order of a few milliseconds. This feature makes it ideal for heart rate variability analysis. This also off-loads the R-R detection algorithm from the main microcontroller, allowing it to be used for user-defined programs. This allows HeartyPatch to do most of the processing on the device itself, without sending it to a cloud for analysis. HeartyPatch provides a continuous plot of the Poincare plot as well as distribution of R-R intervals.
HeartyPatch comes pre-loaded with firmware that can:
- Flash the on-board RGB LED in sync with each heart beat
- Use the Bluetooth Low Energy (BLE) service to provide real-time, instantaneous heart rate that works with any smartphone/tablet app that supports the BLE SIG heart rate profile
- Send detailed HRV data over the onboard USB port
Re-programming the onboard ESP32 is required only if you wish to use custom firmware for custom applications.
Again, HeartyPatch is an ongoing project and additional software/functionality is in development.