Project update 5 of 14
Measurement Examples
by Prajay MadhavanIn these five examples, we’ll capture accurate measurement data of many different electronics including a remote control, a capacitor, and an ESP8266 - all with the ZS1100A.
1. Current profiling an IR remote control
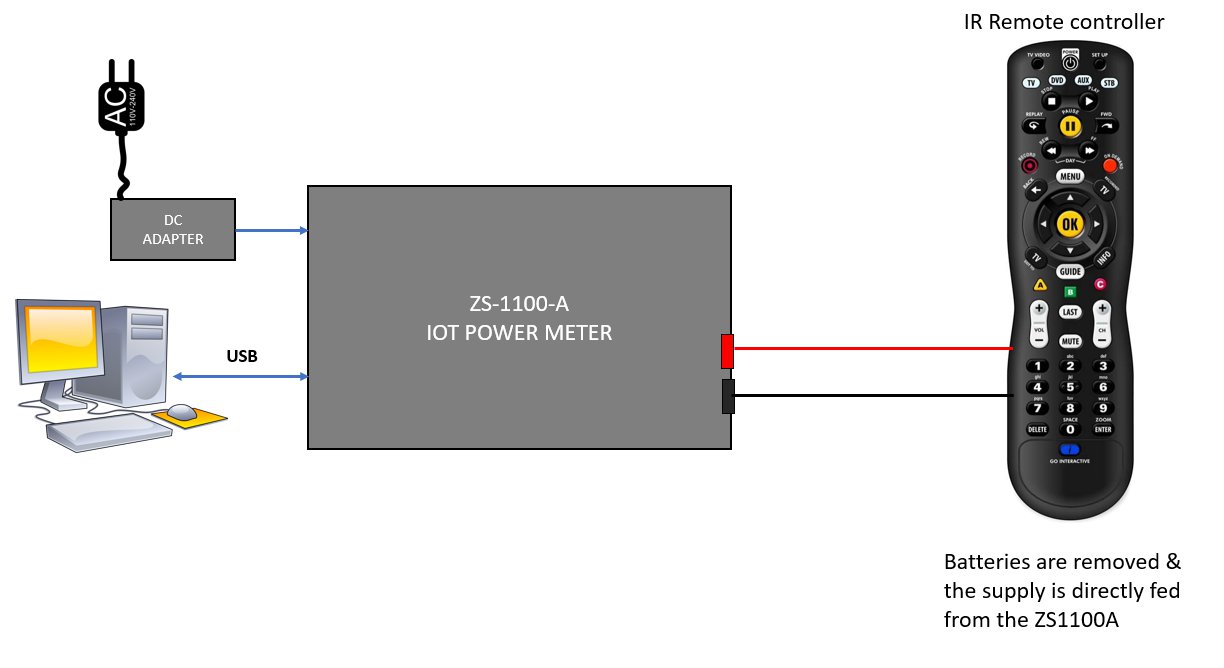
In this measurement example, an IR remote controller is powered directly by the ZS1100A. The 3 V batteries are removed and the leads are directly powering the remote control. A button on the remote is pressed during the capture.
Measurement Setup
Measurement data
Here the current bursts are seen when any button on the controller is pressed. Using this data, the overall battery life can be estimated very accurately.
After the bursts are completed, the total power consumption drops to about 1.15 uA. The sleep current is verified using a bench multi-meter to be accurate to within +/- 0.2 uA. Note : The high noise in sleep state is due to the log scale of the display.
2. Inrush current of a filament bulb
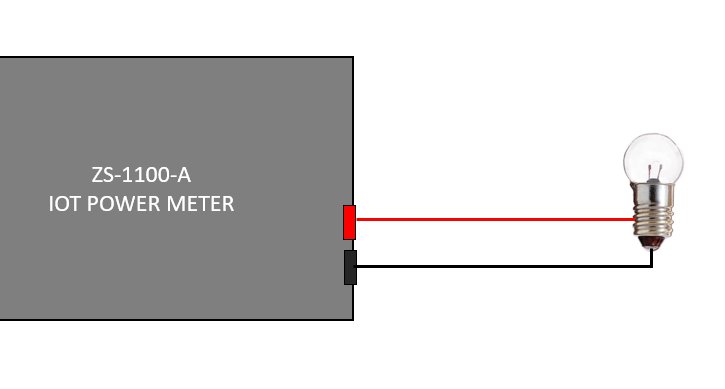
In this example, a DC filament bulb is connected directly to the output of the ZS1100A. The capture is started and then the output is enabled.
Measurement setup
Measurement data
The bulb starts off with a low resistance, as the filament is cold. This shows up as the high in-rush current which reaches up to 600 mA. Then as it heats up, the resistance quickly increases and the current settles down to about 180 mA. Measurement of the current profile allows for proper power budgeting of the power supply. High spike currents, if not accounted for, can cause power drops and system reboots. The ZS1100A helps in estimating the peak current requirement from a power supply.
3. Linearity test
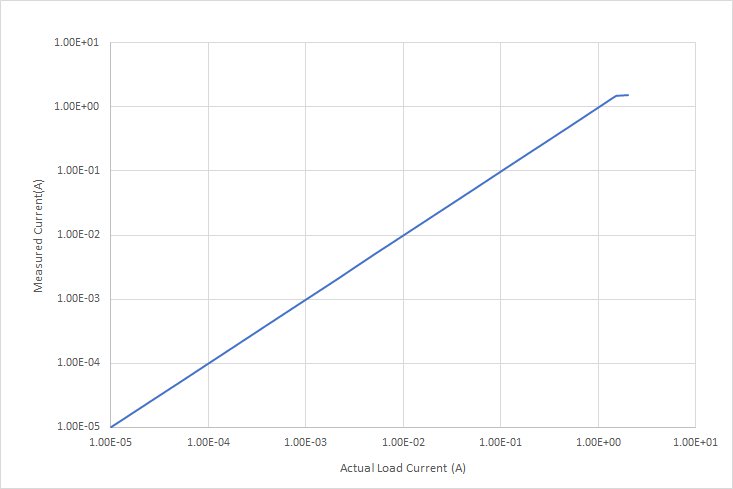
This is measured by feeding a known current through the ZS1100A and measuring the average current from the GUI
Clearly the measurement is highly linear across the range till the maximum measurement. The same linearity exists in the negative direction till -0.5 A.
4. ESP8266 Wi-Fi module current measurement
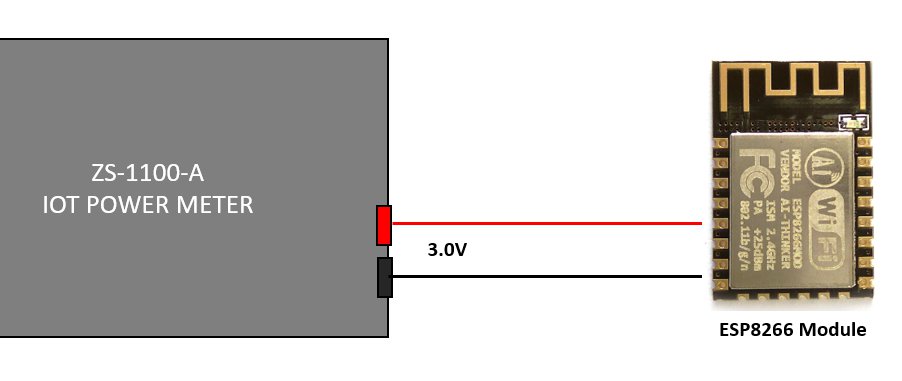
In this experiment, we measure the current profile of a popular Wi-Fi module from Espressif, the ESP8266. The module is programmed to connect to an access point, perform some data transactions and then go to sleep mode.
Measurement setup
Measurement data
The chart below shows the initial calibration cycle performed by the module. The transitions of the various power states of the power amplifier are clearly visible on the chart.
Fast and Complex Waveforms:
After the calibration, the module tries to connect to an access point. The graph below captures one such current pulse during the transmission phase.
Step Response:
The pulse width is well within 1 ms and the rise time is of the order of few micro seconds. The fast response time of the ZS1100A enables the measurement of such short pulses. In most IOT devices, major energy is concentrated in these pulse currents and accurate measurement of these is critical to battery life estimation.
Dynamic Range:
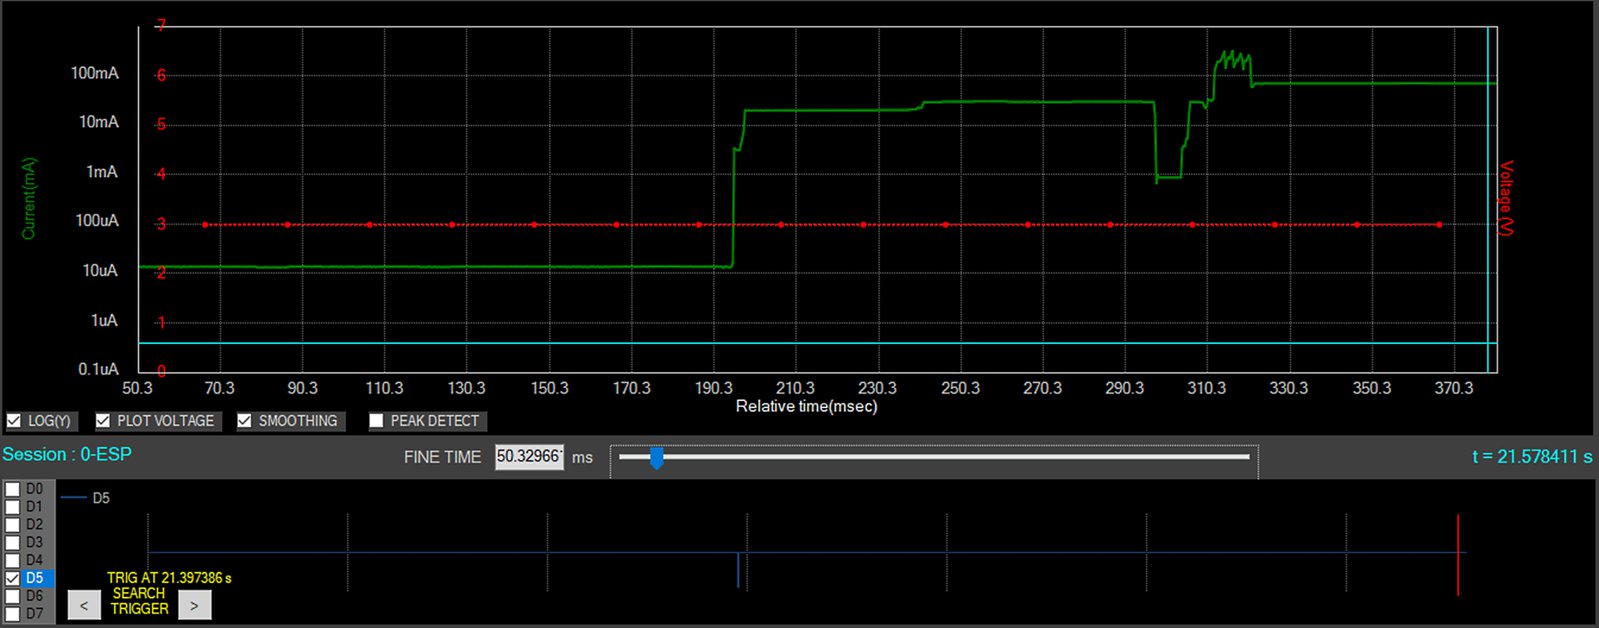
The chart above shows the dynamic range of the tool. The sleep mode (16 uA), Idle mode (few mA) and the transmission mode (several 100 mA) are all captured in a single range. The digital signal used to wake-up the module is also captured here.
5. Capacitor charging and discharging
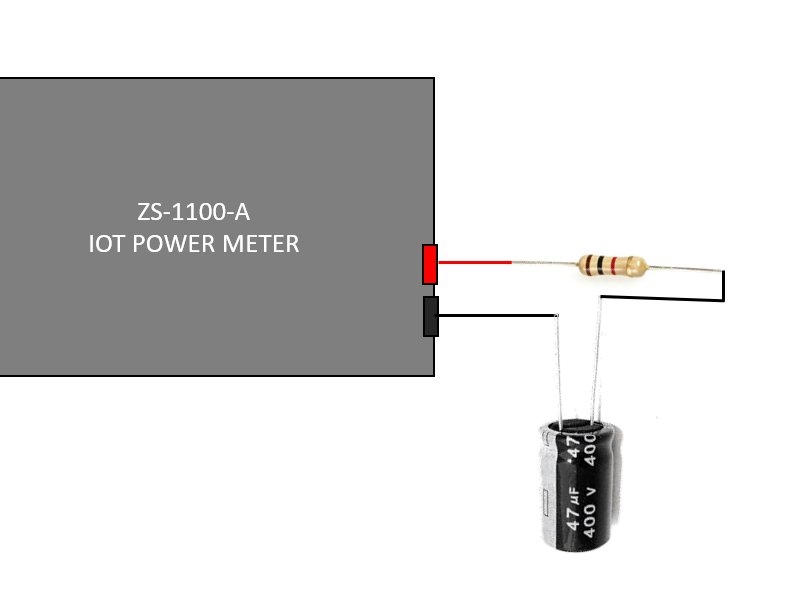
In this experiment, an RC circuit is connected to the output of the ZS1100A. The objective is to be able to plot the charging current of the capacitor. (Ignore the values of the RC)
Measurement setup
Measurement data
The output is turned ON during the measurement process. The capacitor charges through the resistor and the classic exponential curve is captured here. Notice the smooth waveform which is possible by advanced noise reduction techniques. Several circuit design techniques are incorporated in to the tool to achieve this distortion free capture. Solutions based on rapid range switching and current steering often suffers from range switching artifacts which could distort the captured waveform.
The ZS1100A uses precision analog techniques and advanced DSP algorithms to achieve the high dynamic range and linearity, without any range switching.
