Project update 12 of 21
New Software Features
While waiting for the final prototype to come back from MacroFab, I’ve spent some time cleaning up some odds and ends on the software, testing out the old prototype further, and adding some cool new software features.
First, I’ve finalized the voltage ranges and cleaned up how they’re shown on the GUI. The board will go from +-3.5mV, +-35mV, +-350mV, and +-3.5V full-scale, depending on the gain you use. Notice how little noise there is on this latest version too!
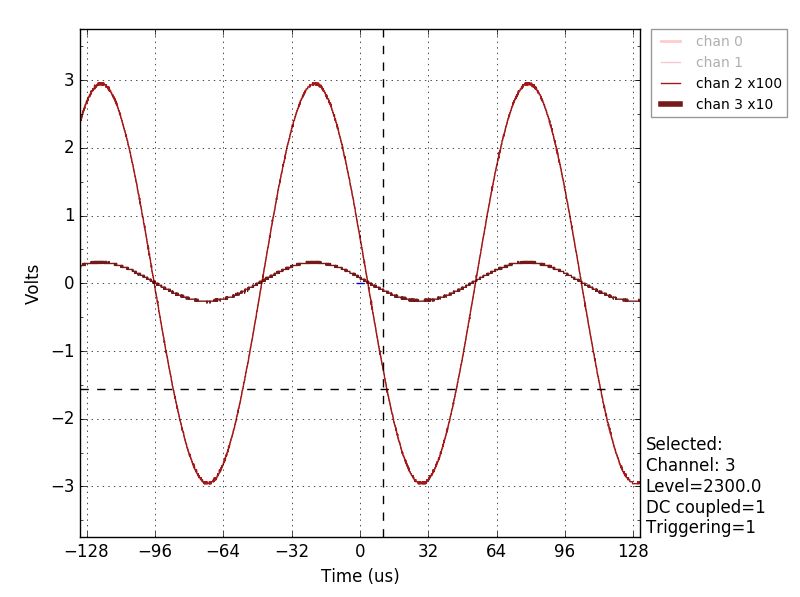
I’ve also written a calibration routine, that will set the DAC offset voltage so that no matter what gain you’re on, or AC/DC coupling, 0V will be in the middle of the screen, as you’d expect! I’ll pre-calibrate your board, and will include a file (in .json format) that will be loaded when you start the python GUI. The file is tied to the 64-bit unique ID of the FPGA soldered to each board, which I now read out into the python software. You can also easily save your own calibration file, in case the best settings change due to various conditions.
I also sped up the USB2 interface. For those of you who bought the add-on USB2 board, this is going to be great. You now really get ~4MB/s transferred to the python software. That’s about 200 Hz, for 4 channels of 4096 samples each! The key was to understand a quirk of the FTDI chip that I’m using to interface from the FPGA to the USB2 connection. The data is only sent to the PC when either 1) the 1kB buffer on the FTDI chip is full or 2) the "latency timer" expires, every 16 ms, by default. So if you send an amount of data which is not an integer multiple of buffer sizes, you have to wait 0-16 ms until the timer expires and sends the last bit of your data! That meant I was only sending 1/16ms or ~50 Hz of data. The trick is you can also tell the FTDI chip to flush the buffer by strobing the SIWU input. You can see me doing this in the scope trace below - the dark blue pulse at the end says "send it all to the PC now!":
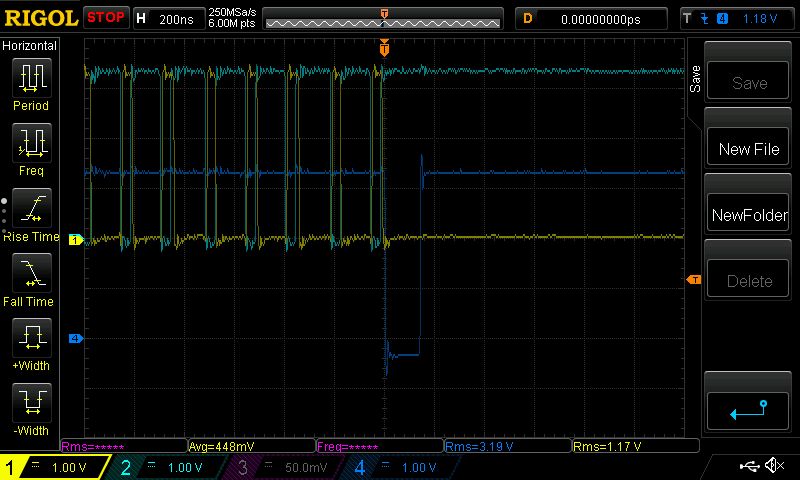
With this we now get ~220 Hz of events sent to the PC over USB2 (vs about 8 Hz over serial!).
One last thing I’ve thrown in is a "persist" display. You might know this from an old analog scope, or a modern digital scope, where you can choose to see many traces at once on the screen. This is especially useful if you want to see rare traces that are quite different from the others, or if you want to see the spread of traces around the average trace. I now optionally store the last N traces and can overlay them on top of each other, where the color of each point reflects how often a traces goes through it. Here’s an example of what it looks like:
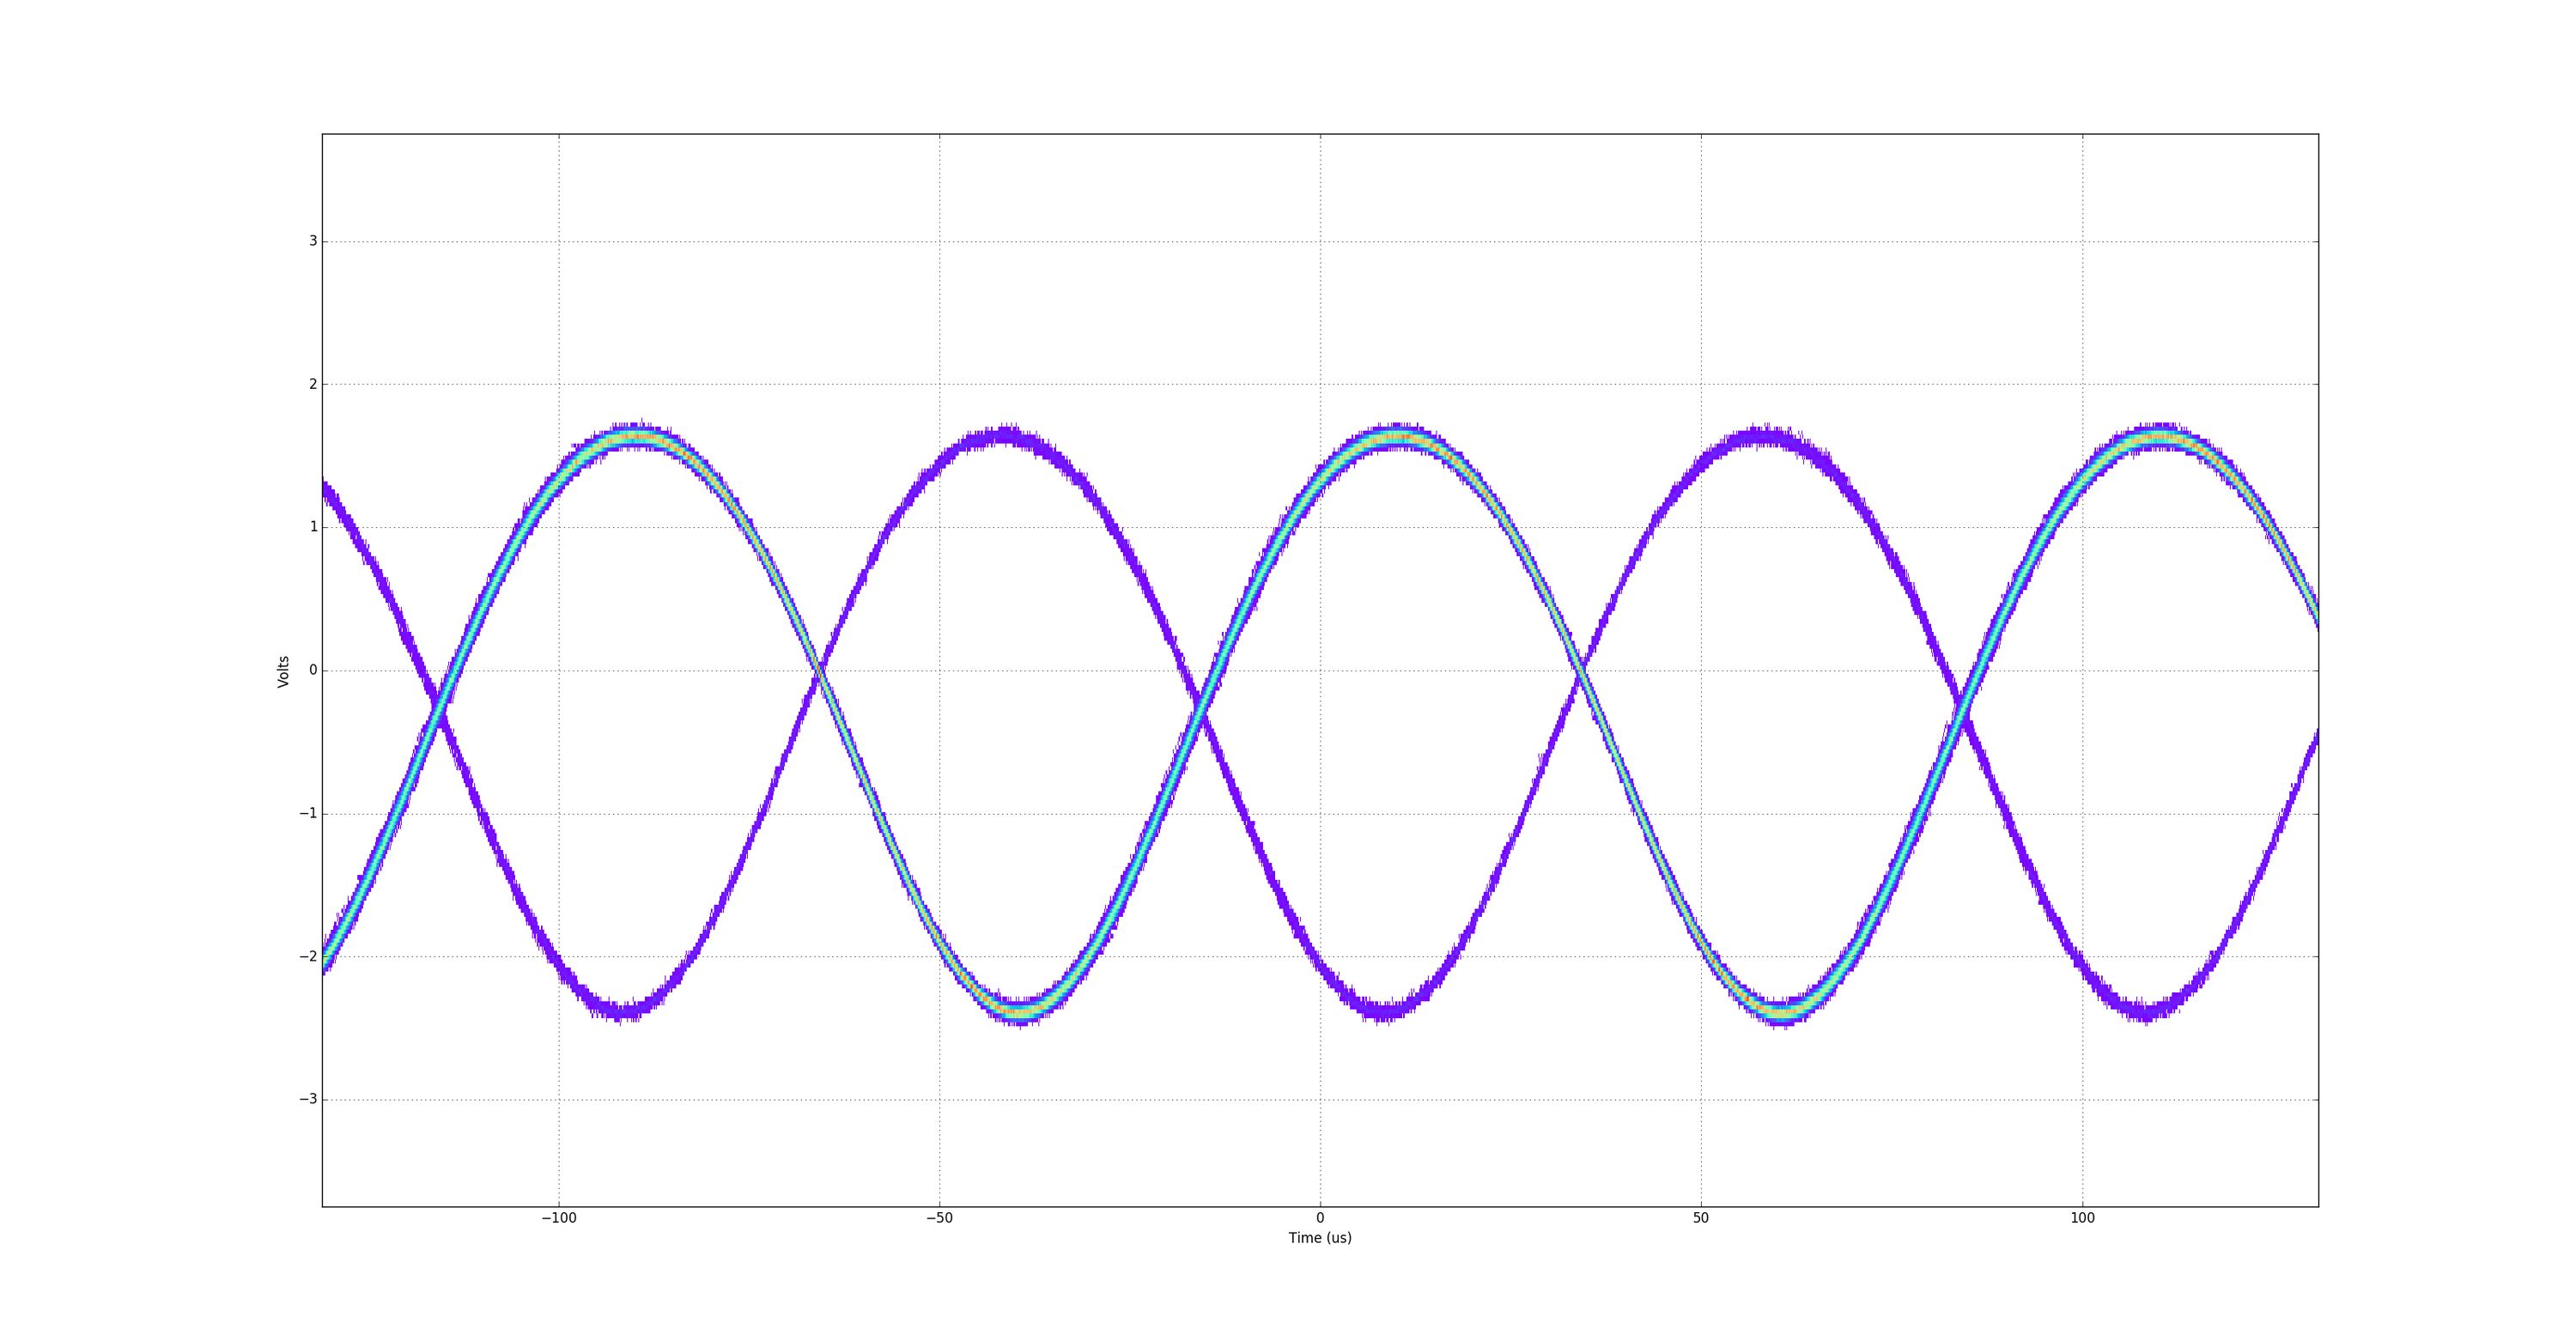
This could even show a ("low" speed) eye diagram! If you don’t know what that is, learn here: https://www.youtube.com/watch?v=mnugUjaMN70