Project update 2 of 10
A Deep Dive Into Our Monitoring Features
by Andy HaasHi all,
Thanks to your initial support, Maxwell is nearly 20% funded in just the first few days - looking good! Keep it coming, please!
In this week’s update, I will take a look at one of the features that really sets Maxwell apart in the world of mesh wifi: monitoring.
Most commercial mesh wifi systems give you almost no clue what’s going on in your system. You might get a page on some app with a pretty picture of each node and a green light next to each one that’s on, but all that really provides is warm fuzzy feelings. But when performance slows to some part of the network, or you get no internet in the bathroom, those green lights are just frustrating!
With detailed monitoring, Maxwell provides tons of details about what’s going on in your network. It is constantly gathering information from the network which is presented clearly on a centralized webpage. This makes it easy to understand what’s going on in your network, fix problems when they occur, and optimize performance. Let’s take a look at some of that monitoring available with Maxwell…
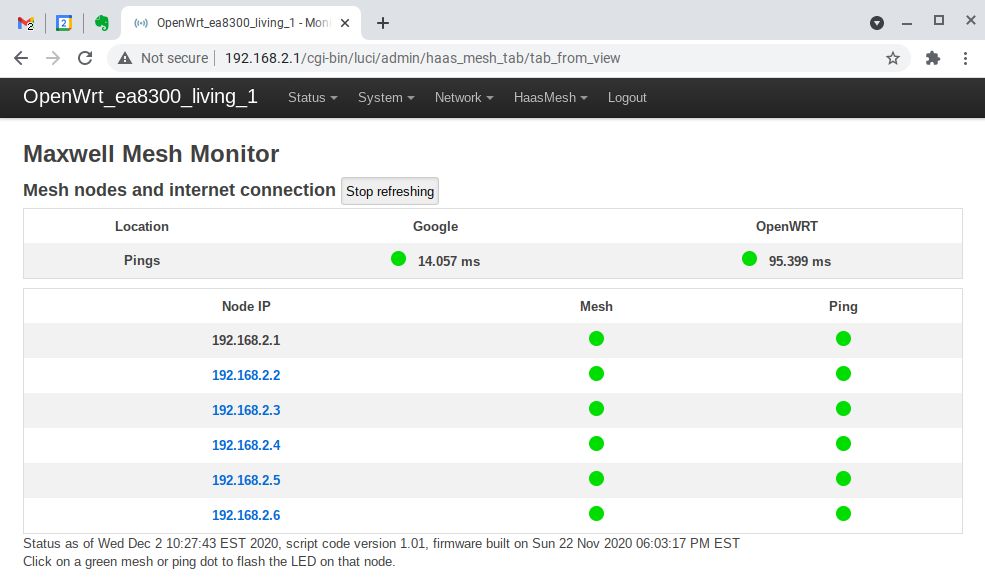
Pointing your browser to http://192.168.2.1 will take you to the main page for your network hub. The first monitoring data you see there is similar to commercial products: a simple green/red light indicating if your system can reach the internet and which of your satellite nodes are online. But Maxwell gives you a little more: the ping times to two different sites, and two pieces of info on each satellite, namely, whether or not it can be pinged and whether or not monitor info is being gathered from it.
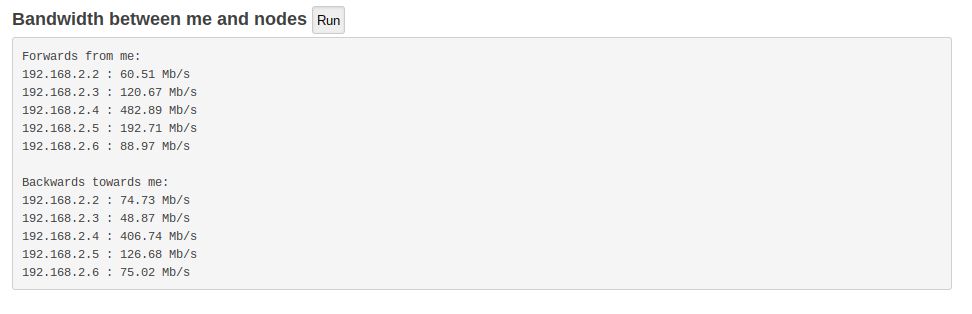
The next thing you’ll want to check is the bandwidth/speed between the hub and each satellite. Maxwell quickly tests the connection and returns the bandwidth in each direction: sending and receiving to and from each satellite. If you want to know the speed between a given satellite node and all other nodes, you can also run this test from the node’s monitor webpage.
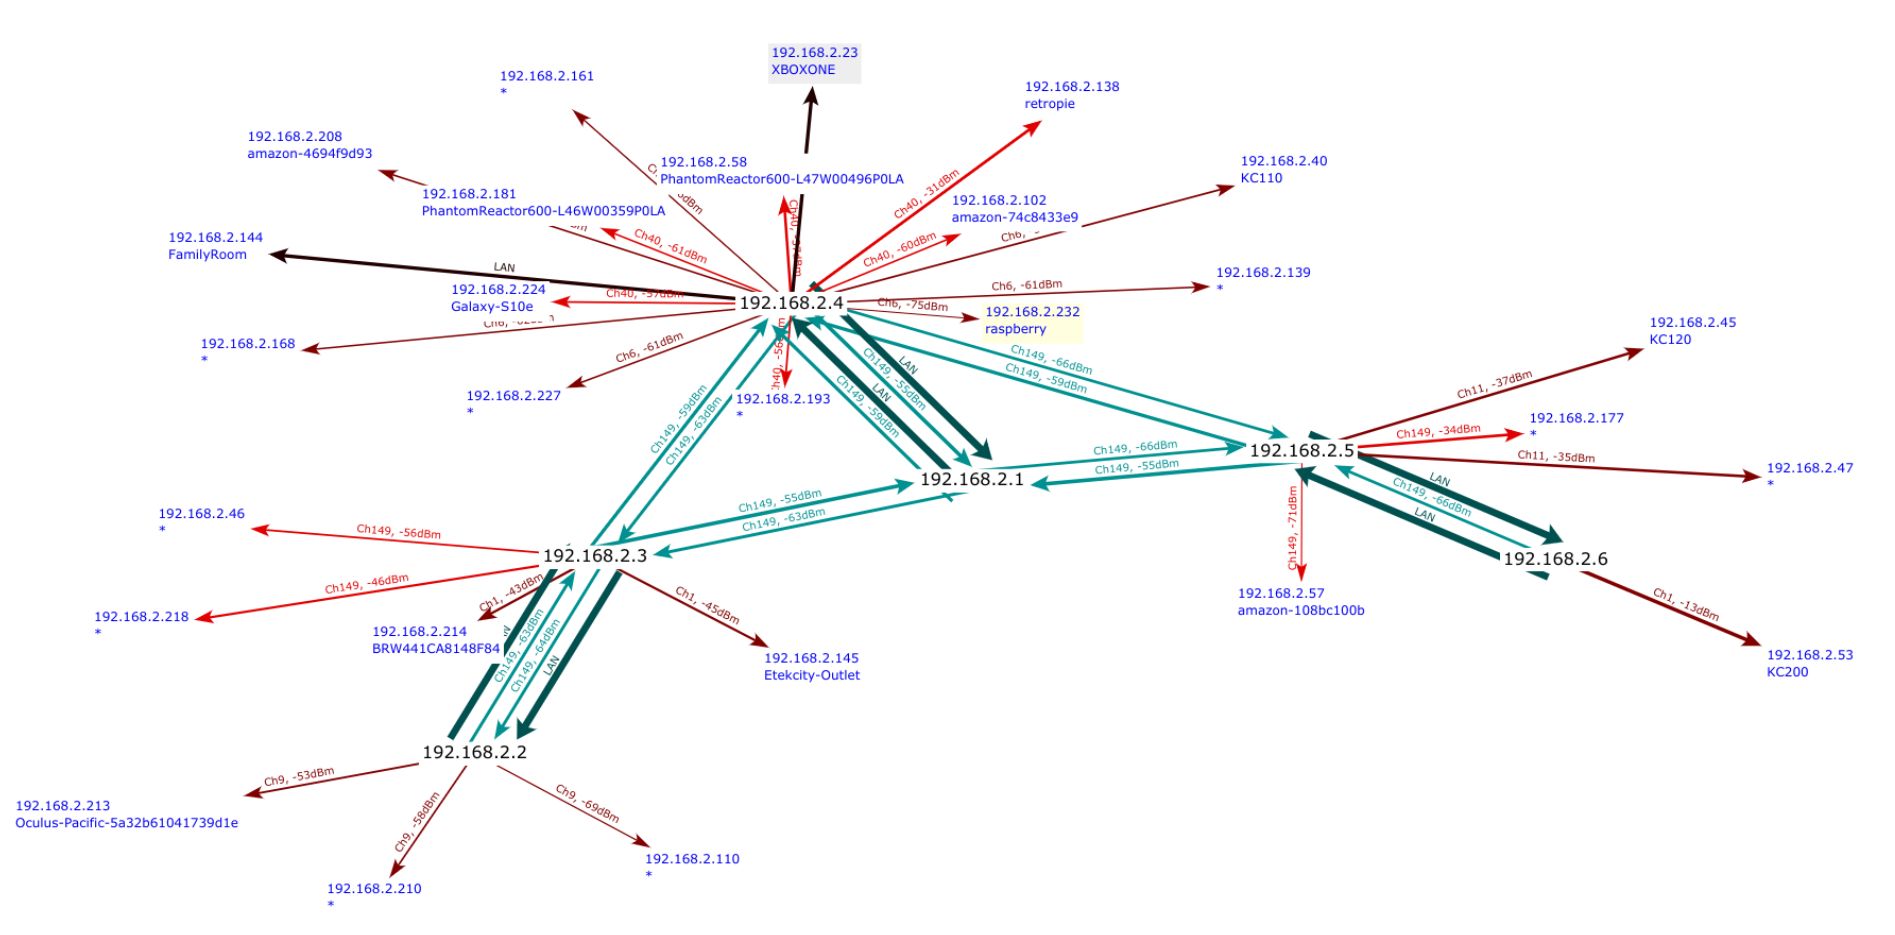
Maybe the most unique feature of Maxwell is its ability to show a detailed network map. This really helps you understand your network. You can see how each of node is connected to each other and what node each client device is connected to, at what signal strength, and on which wifi channel (or LAN if backhaul is being used). For instance, in the image above, you can see 192.168.2.3 is connected to the hub (.1) directly over mesh wifi in both directions, using channel 149 at signal strengths of -55 and -63 dB (positive is stronger, so -55 is stronger than -63). Similarly, you can see that data could get there from the hub by going through .4, either over LAN (wired ethernet backhaul) or mesh wifi, and then over mesh wifi to .3. And for clients, for example, you can see that .5 has four clients currently connected, .45, .47, .177, and .57, along with their respective signal strengths and channels.
It’s also interesting to watch the webpage "figure out" in real time how to draw the network map. Drawing such a node-edge multi-connected map is a non-trivial exercise. It is a non-linear NP-hard problem, like the "traveling salesman", and the topic of many a PhD thesis in computer science. One way to solve such a problem is to make a first guess and then move things so that the map is drawn "better" (things are closer together that should be close together and far enough apart they’re not overlapping), You continue to iterate, making the map better and better with each iteration. This essentially makes frames of a movie, which you can watch in real time thanks to a little JavaScript magic. The algorithm under the hood calculates a "potential energy" for each configuration and then moves things so as to minimize that energy. As a physicist, this model warms my heart!
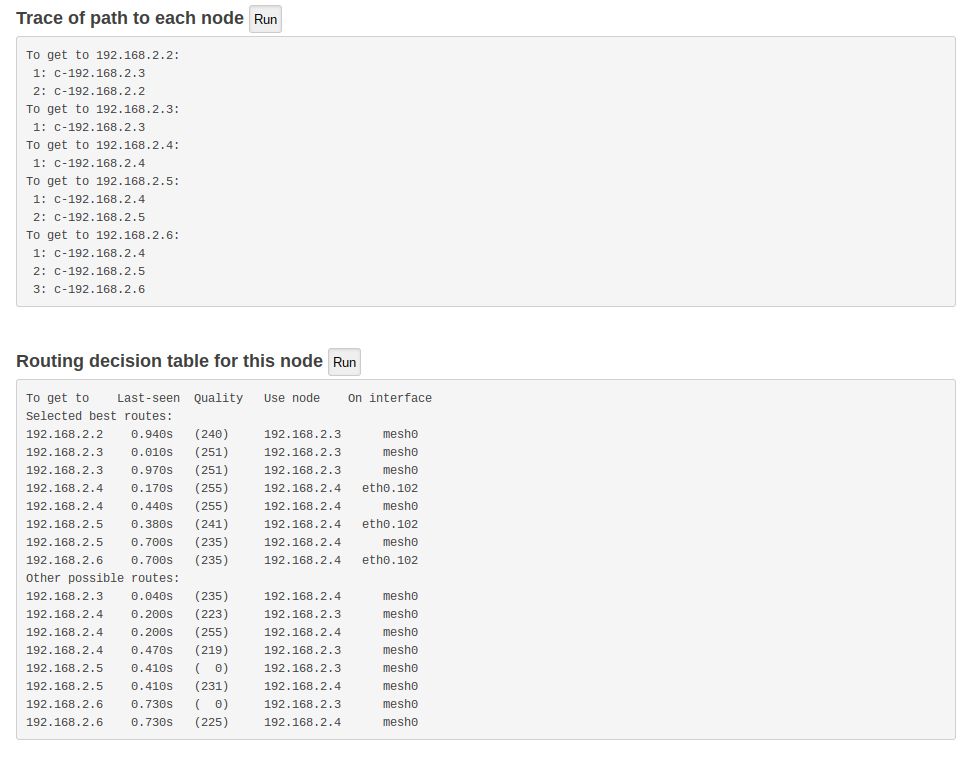
For even more detail, you can show the path data will take from the hub to each node through the network. This tells you which of the possible paths shown in the network map is actually going to be used for data. So you can see that to get to satellite with address 192.168.2.6, the hub sends data first to 192.168.2.4, then to .5, then .6.
You can also see why each path is chosen. The system is always testing, in the background, the paths from node to node looking for the "best" ones. Tests packets get sent over the network, and the speed and quality (packet loss) is measured. Here you can see that to send data from the hub to satellite node 192.168.2.5, there are two paths: one sending to .4 over eth0.102 (Gb ethernet backhaul) or another over mesh wifi to .4,and then over mesh wifi to .5. These paths have scores of 241 and 235, respectively, so backhaul is chosen. There are also some other, even poorer, paths for getting through the network, as shown below in the table. This can really help you understand what’s going on if a given connection is performing poorly. You can see where data is not taking an optimal path, so you can more quickly resolve network issues. (For example, you could check the settings on the wireless control page.)
Of course, Maxwell also allows you to dig even deeper into detail, with a full OpenWRT web interface showing very detailed wireless and network information for each node. Yu can even ssh into each node and use the full power of Linux to debug, down to each line of code in the kernel. Meanwhile, the Maxwell monitoring webpage provides useful information at your fingertips, so you can more easily keep your network running smoothly.