Project update 1 of 3
Predictive Maintenance Demo
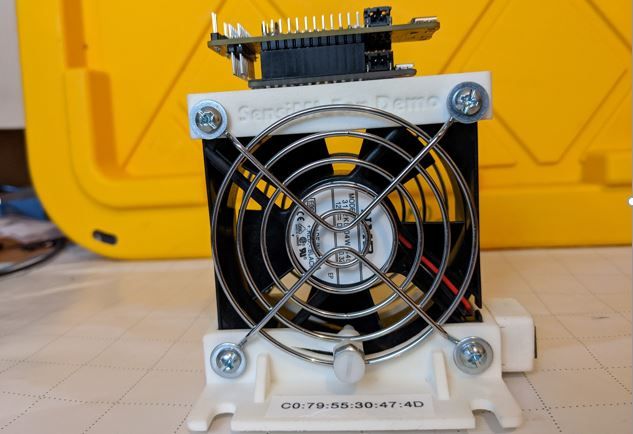
In this tutorial, our partners at QuickLogic & SensiML build a predictive maintenance application for a fan that can run entirely on the SparkFun Thing Plus - QuickLogic EOS S3 using SensiML Analytics Toolkit.
Enjoy!
The SparkFun Team
Overview
This tutorial focuses on condition monitoring for predictive maintenance, but these technologies apply to a variety of tinyML applications, such as gesture and activity recognition, sound classification, and keyword spotting.
Objectives
- Demonstrate how to collect and annotate a dataset of machine state events for the fan using the SensiML Data Capture Lab.
- Build a data pipeline to extract features in real-time for the SparkFun Thing Plus - QuickLogic EOS S3.
- Train a Classification model using SensiML AutoML.
- Convert the model into a Knowledge Pack and flash it to the SparkFun Thing Plus - QuickLogic EOS S3.
- Perform live validation of the Knowledge Pack running on-device using the SensiML Streaming Gateway.
Building a Data Set
For every machine learning project, the quality of the final product depends on the quality of your curated data set. Time series sensor data, unlike image and audio, are often unique to the application as the combination of sensor placement, sensor type, and event type greatly affects the type of data created. Because of this, you will be unlikely to have a relevant dataset already available, meaning you will need to collect and annotate your dataset.
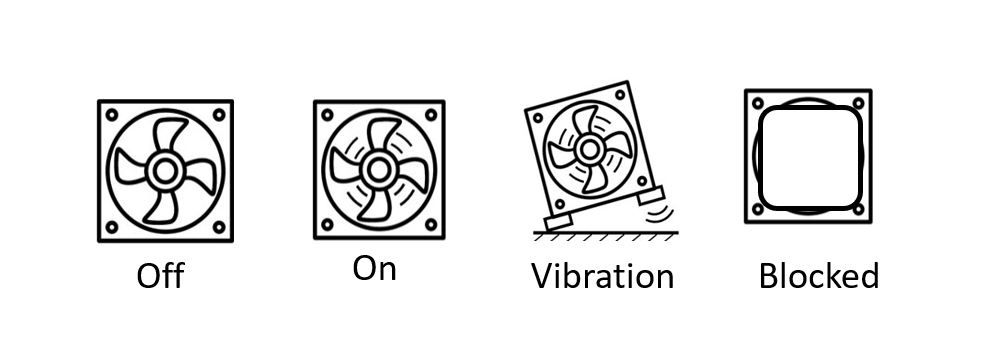
We are going to use the SensiML Data Capture Lab to collect and annotate data for the different four different fan states states.
We created a template project to get you started. The project has been prepopulated with the labels and metadata information, along with some pre-recorded example files from our fan. To add this project to your account:
- Download and unzip the Fan Demo-QuickThing Project.
- Open the Data Capture Lab
- Click Upload Project
- Click Browse, Navigate to the Fan Demo-QuickThing folder, and select the Fan Demo-QuickThing.dclproj file
- Click Upload
In the next few sections, we are going to walk through how we used the Data Capture Lab to collect and label this dataset.
Streaming Sensor Data
For this tutorial, we are using the SparkFun Thing Plus - QuickLogic EOS S3. We are collecting data over a wired USB connection. We have configured this SparkFun Thing Plus to capture Accelerometer data at a sample rate of 100Hz. Make Sure you have flashed the SparkFun Thing Plus - QuickLogic EOS S3 Data Collection Firmware. You can get pre-built data collection binaries for UART and Serial output here
To capture data in the Data Capture Lab over Wi-Fi:
- Make sure you have flashed your device
- Switch to the Capture mode in the Data Capture Lab
- Make sure the SparkFun Thing Plus - QuickLogic EOS S3 Sensor capture configuration is selected
- Select Capture Method: Serial
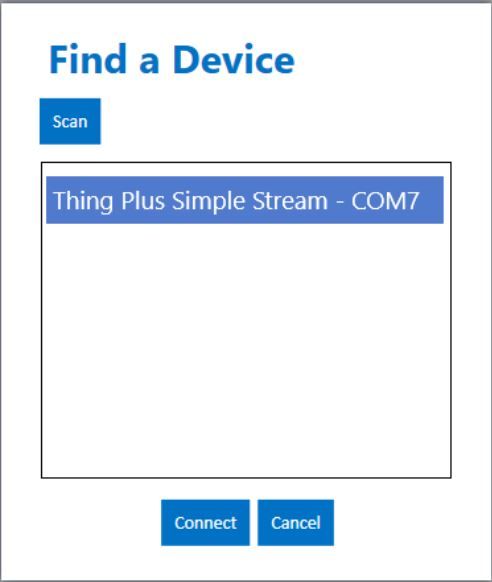
- Click the Find Devices button
- In the window that pops up, click the Scan button
- Select the COM port for your device
- Click the Connect button
More detailed instructions on Wi-Fi data capture are in the documentation.
Recording Sensor Data
You should now see a live stream of the sensor data. Before you record data, fill in the metadata and label that you intend to collect data for. Maintaining good records of sensor metadata is critical to building a good machine learning model.
To start recording sensor data, hit Begin Recording. When you hit Stop Recording, the sensor data will be saved locally to your machine as well as synced with the SensiML Cloud project. Along with sensor data, it is also useful to capture video data to help us during the data annotation process. We record the video with our webcam and will sync it to the sensor data when we start labeling the dataset.
The video below walks through capturing and syncing the data to your cloud project with the Data Capture Lab.
Annotating Sensor Data
Now that we have captured enough sensor data, the next step is to add labels to the dataset to build out our ground truth. To add a label to your data:
- Open the Project Explorer tab and double-click one of the captures that you collected.
- Once the capture file opens, right-click on the graph. This will place a blue and red bar. The blue bar is the start of the segment, the red bar is the end.
- Move the start and ends of the segment to cover an entire region of the Fan state.
- With the segment still selected, press Ctrl+e or click the Edit Label button and select the label that is associated with the sensor data.
You have now labeled a region of the capture file which we can use when building our model. The video below walks through how to label the events of a captured file in the SensiML Data Capture Lab.
Building a Model
The SensiML Analytic Studio is where you can create a query to pull data into your model, build models using AutoML, validate model accuracy against raw signal data, and finally download your model as firmware code for the target device. For the next part of the tutorial, you will need to log into Analytic Studio. Building a model using the SensiML Workflow takes four steps:
- Create a query to select the input data for modeling
- Train a model using AutoML
- Validate your model against Test Data
- Download the firmware, flash, and test it on your SparkFun Thing Plus - QuickLogic EOS S3
Project Summary
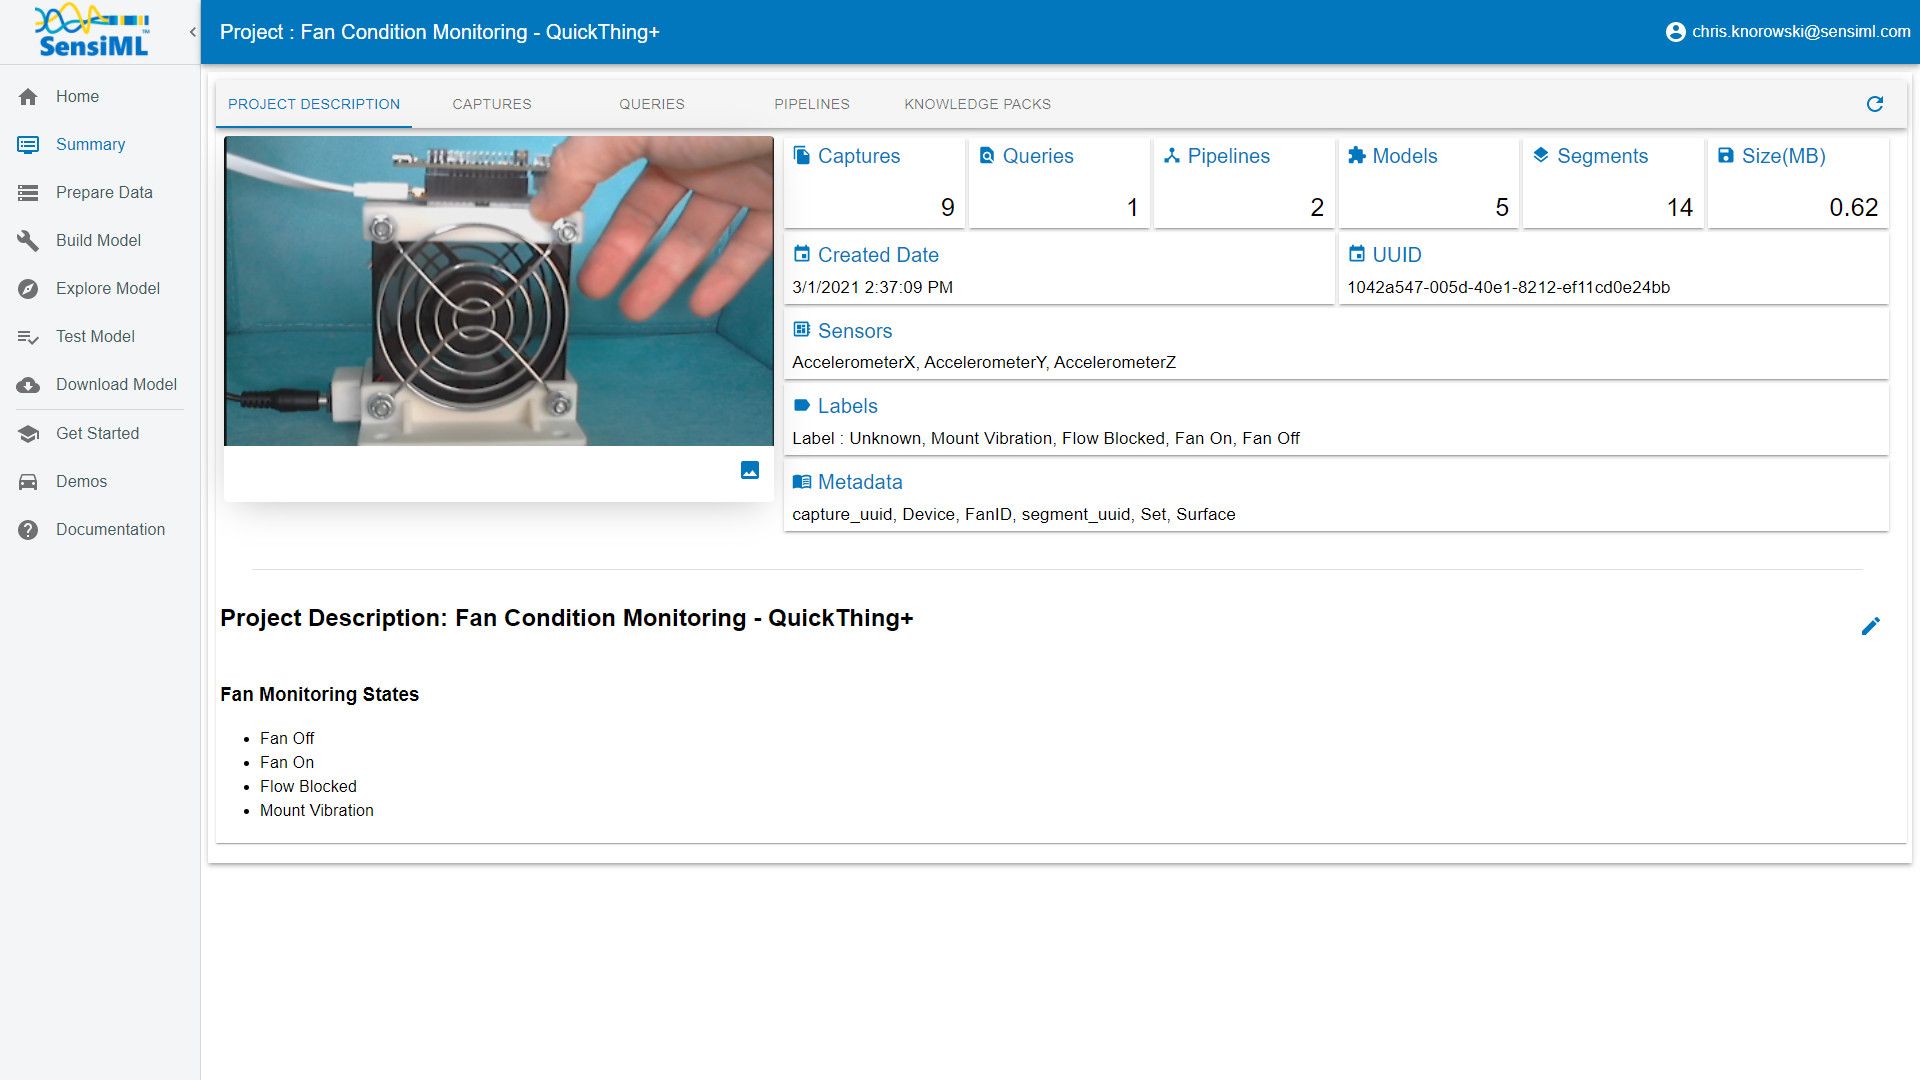
Select the Fan Demo-QuickThing project you just created with the SensiML Data Capture Lab. You will see an overview of all the captures, queries, pipelines, and models that are part of the project. At this point, there are only captures. We will need to create a query and run an AutoML pipeline against the data in that query to generate data models.
Creating a Query
Go to the Prepare Data tab to create a query. The query is used to select your sensor data from your project. If you need to filter out certain parts of your sensor data based on metadata or labels, you can specify that here.
- Click Create New Query
- Select the following properties:
- Query Name: 5 State
- Session: My Training Session
- Label: Label
- Metadata: Segment_UUID, Train
- Source: Select all columns
- Filter: [Set] IN [Train]
- Click Add New Query
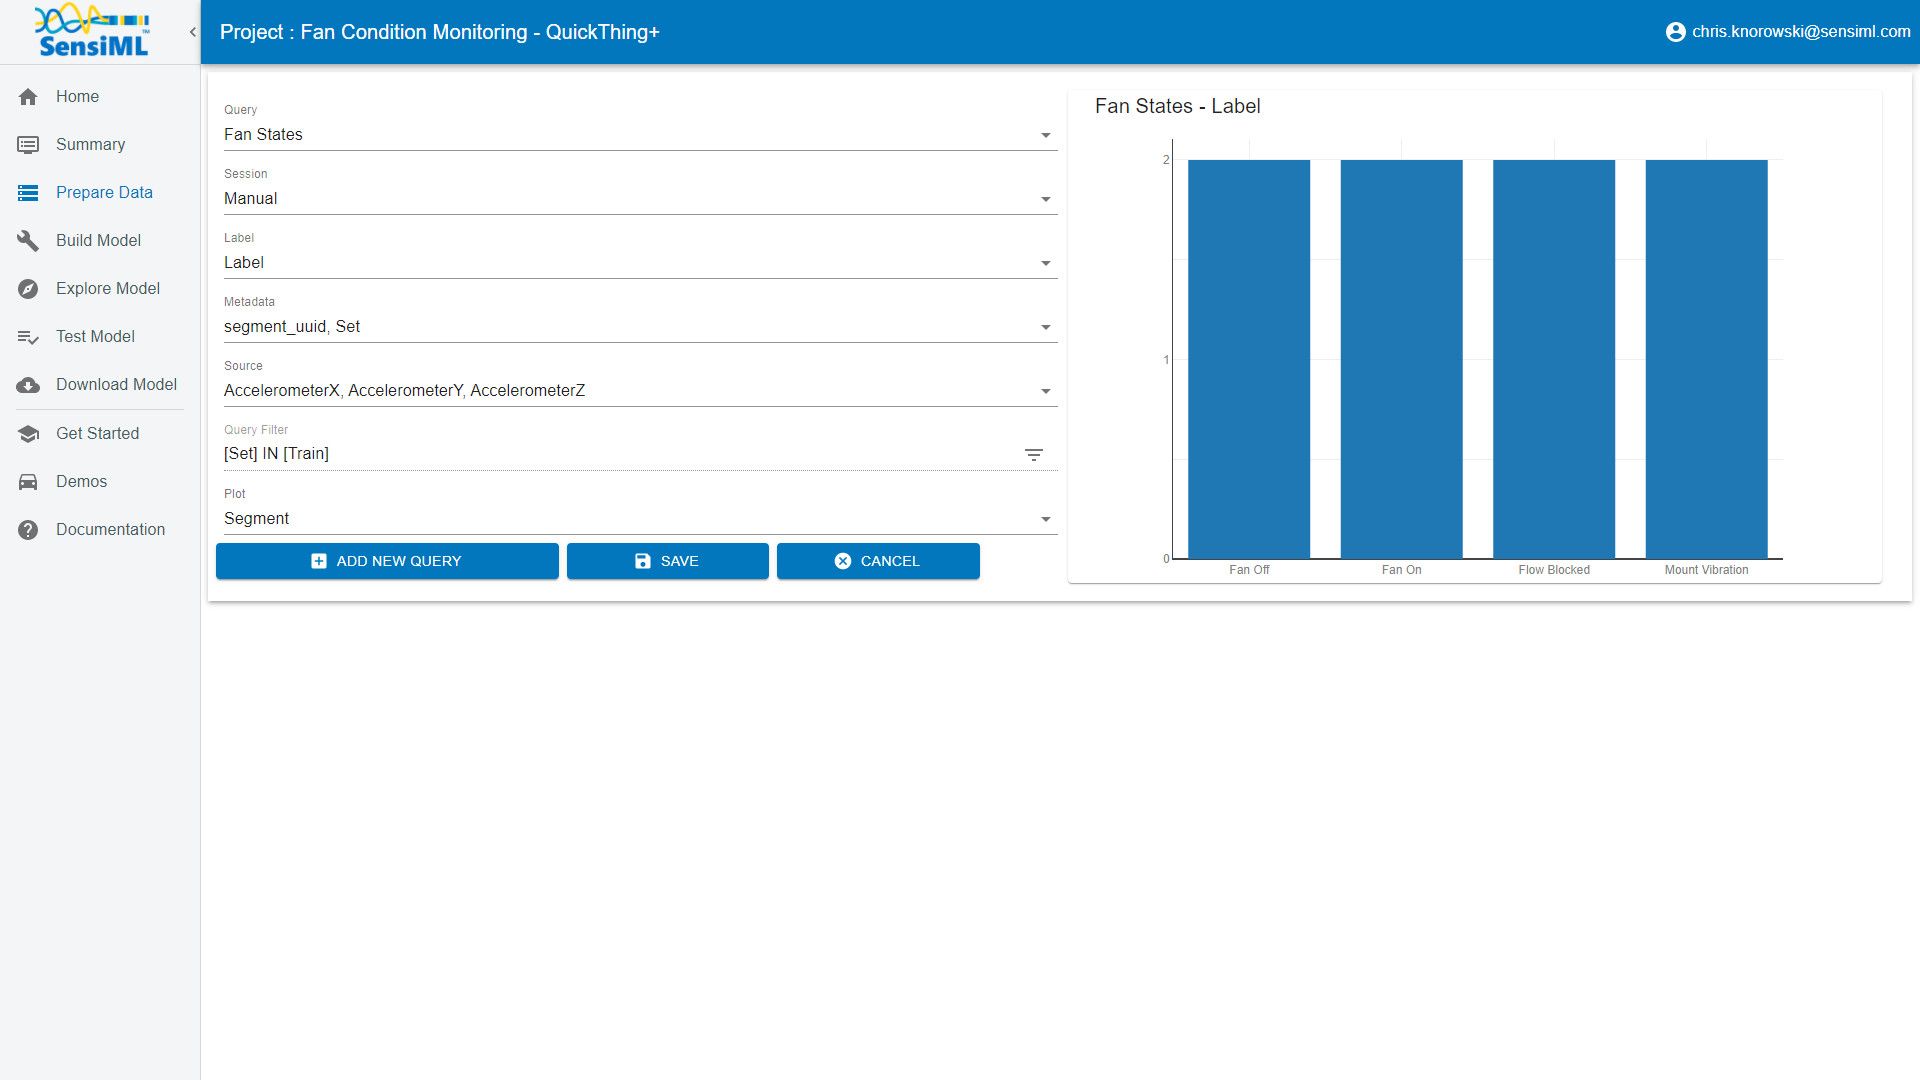
The Analytics Studio will count all the events of interest you have labeled in this project and graph them.
Creating a Model Using SensiML AutoML
After you have created a query, you will use that to specify the data to input into the machine learning model. The models created in AutoML consist of signal preprocessing, feature extraction steps, and a classifier.
AutoML is used to create a set of models within the desired statistical (accuracy, f1-score, sensitivity, etc.) and classifier size. As the algorithm iterates each optimization step, it narrows down the search space to find a desired number of models. The optimization terminates when the desired model is found or the number of iterations reaches the maximum number of iterations.
We take advantage of dynamic programming and optimizations for training algorithms to speed up the computation. This makes it possible to search large parameter spaces quickly and efficiently. The results are ranked by the fitness score, which considers the model’s statistical and hardware parameters.
There are several preprocessing steps and feature generator families that can be specified in the advanced settings. These settings can improve the model accuracy, depending on your application. For this use case, we want to remove the mean from each of the input channels. You can also select the type of validation method to use along with the types of feature families to search over.
Once the models have been generated, you can explore the details of the top five candidate models in the explore models tab. In this tab, there are visualizations and information about the models, including features, confusion matrix, model hyperparameters, and the Knowledge Pack training and inference pipeline.
The following video walks through both building and exploring models in the SensiML Analytics Studio.
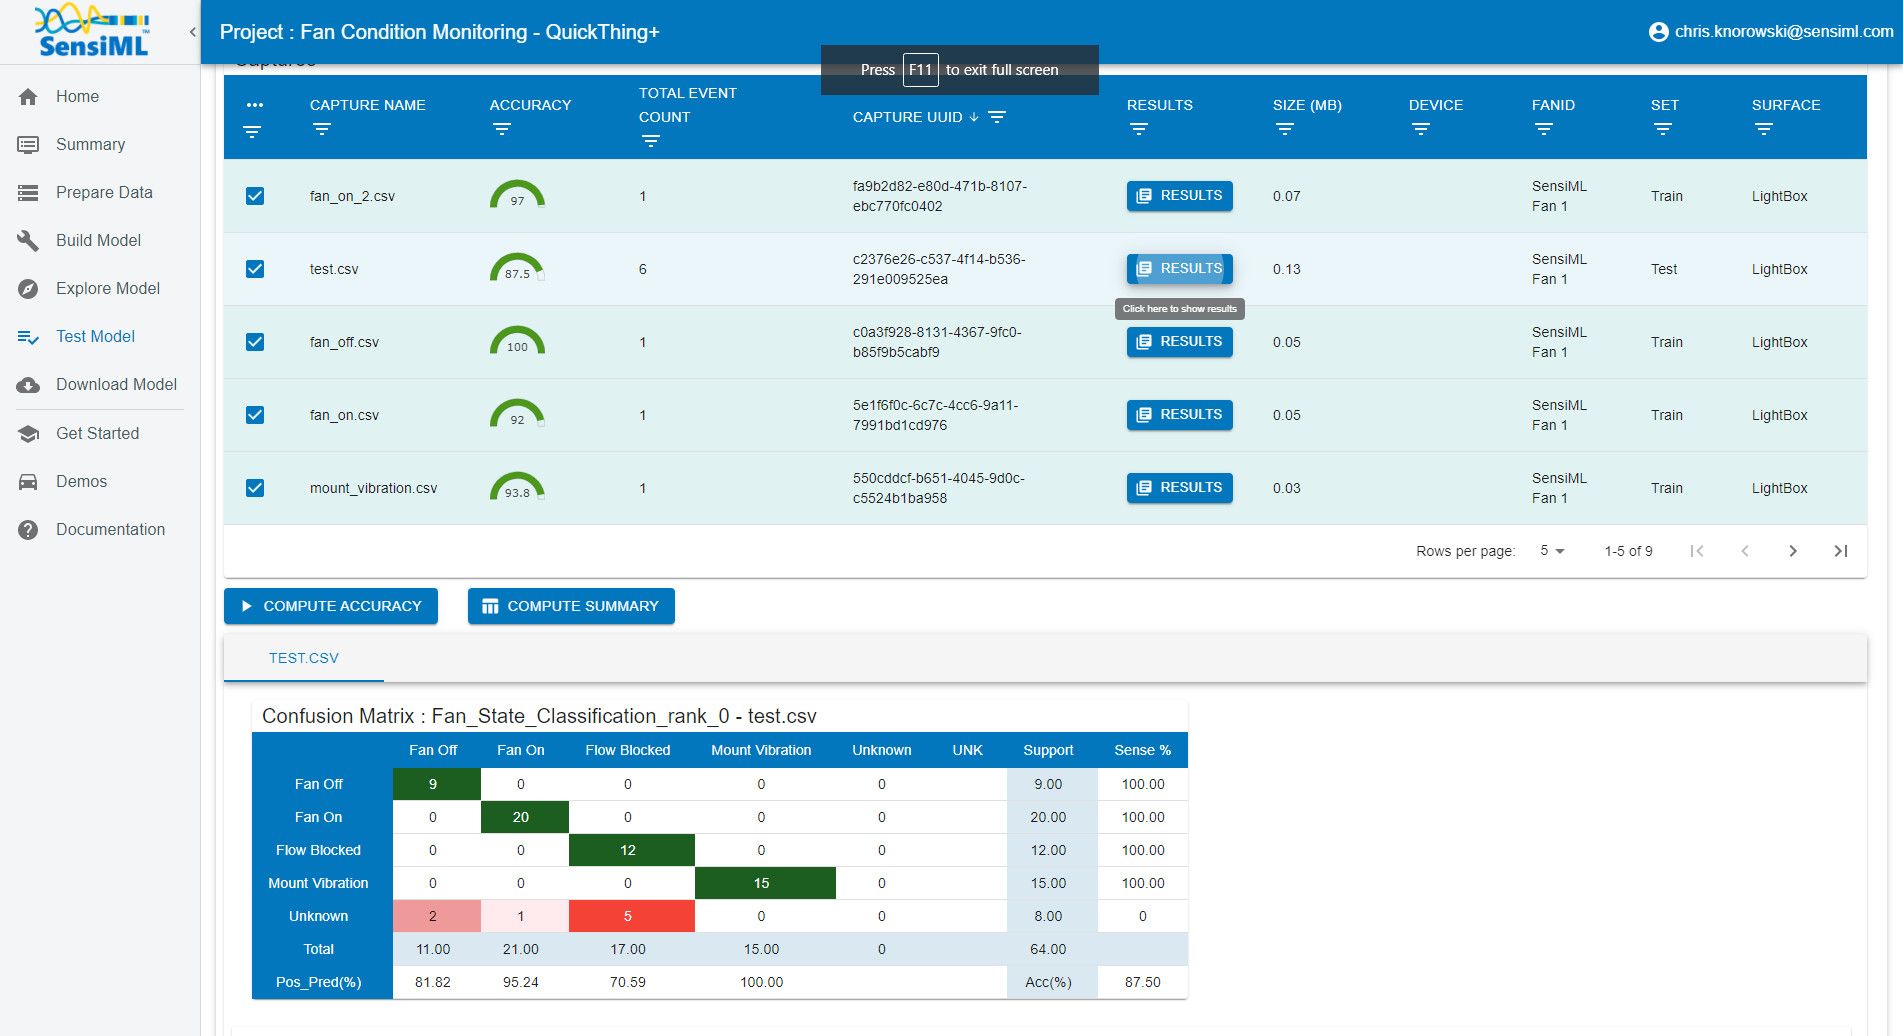
Offline Model Validation
Before you flash the model to the device, you can test the model using the Test Model tab. You can test against any of the captured data files. To do this:
- Select the pipeline you built the model with.
- Select the model you want to test.
- Select any of the capture files in the Project.
- Click the Compute Accuracy button to classify that capture using the selected model.
The model is compiled in the SensiML Cloud and the capture files are passed through it to emulate the edge device’s classifications against the selected sensor data.
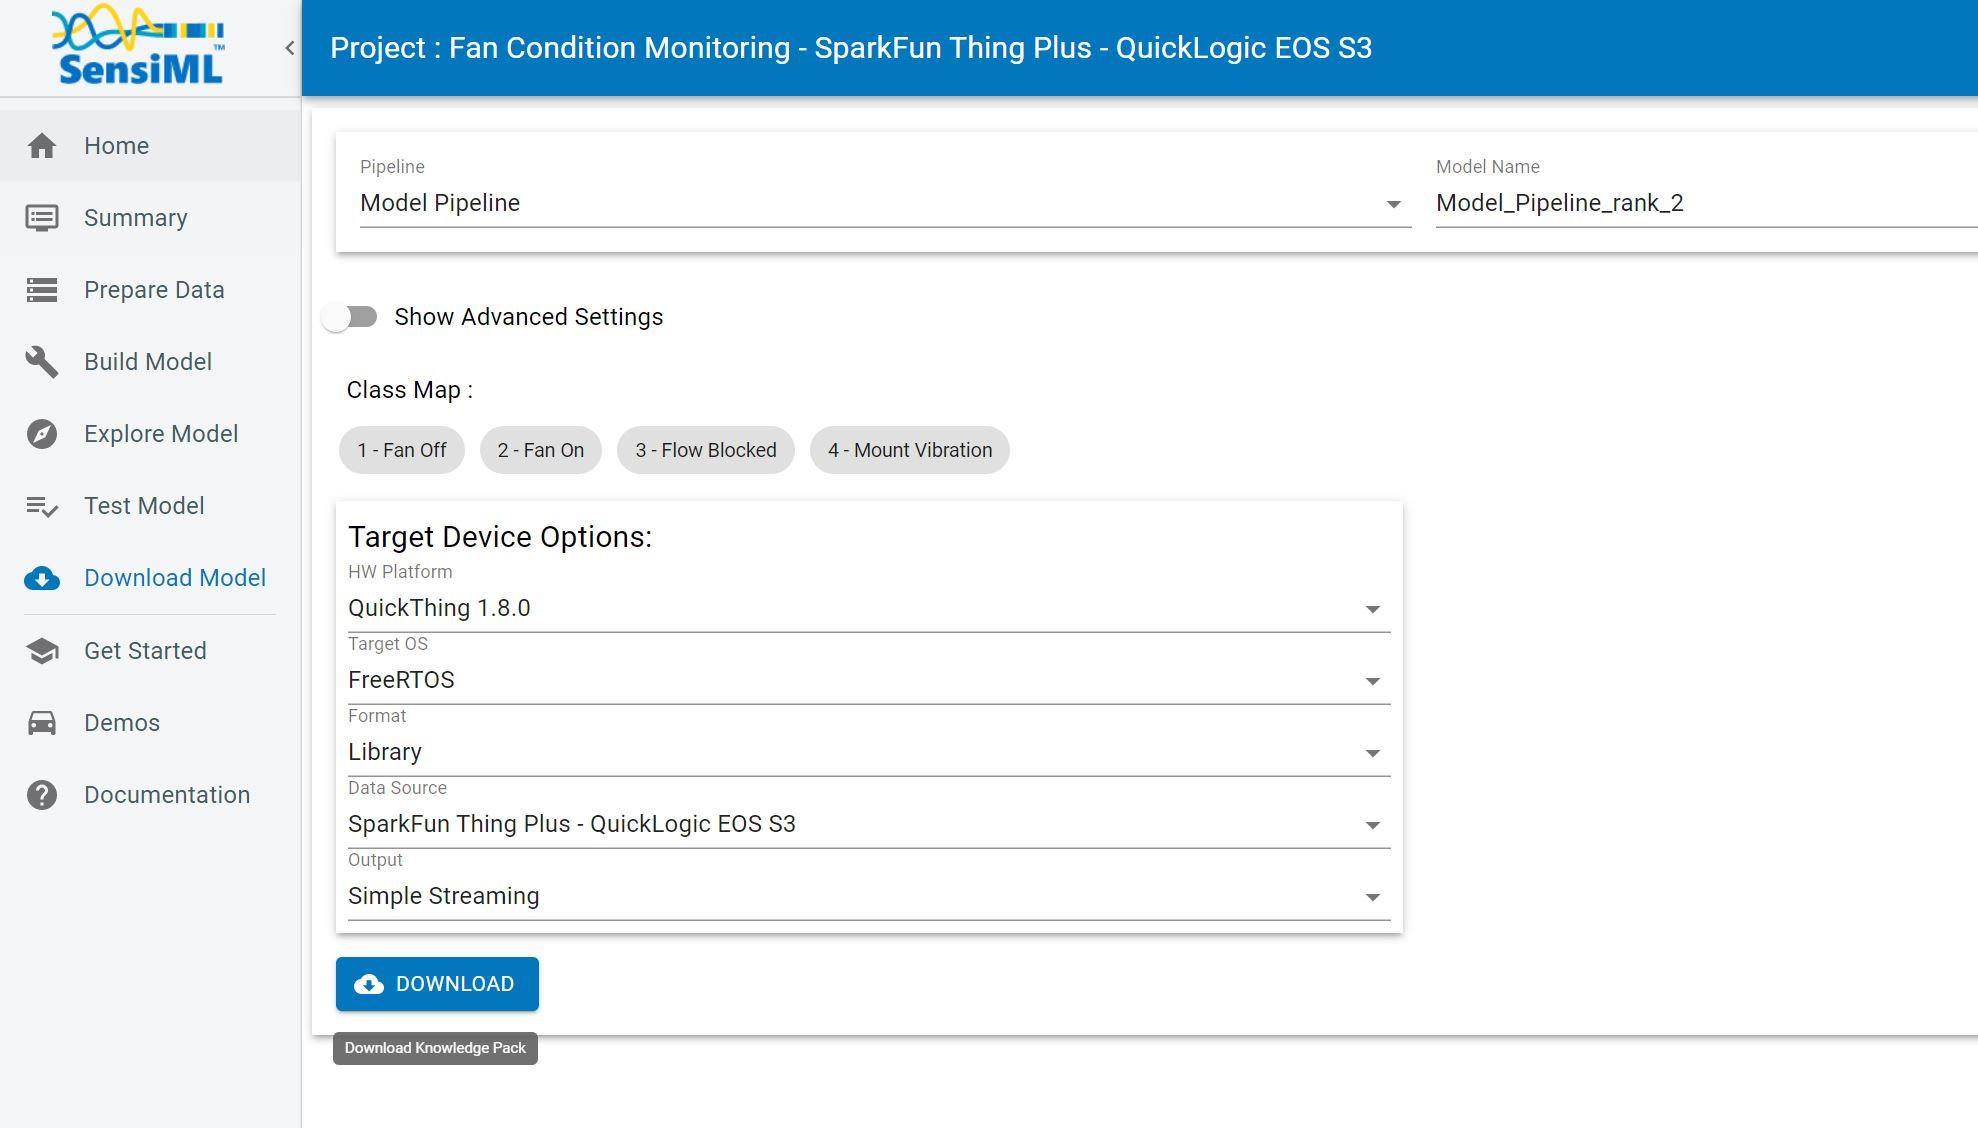
Downloading the Knowledge Pack
Now that you have validated your model it is time for a live test. To build the firmware for your specific device, go to the Download Model tab of the Analytic Studio. To download the firmware for this tutorial:
- Go to the Download Model tab of the Analytic Studio
- Select the pipeline and model you want to download
- Select the HW platform SparkFun Thing Plus - QuickLogic EOS S3
- Select Format Binary
- Click Download and the model will be compiled and downloaded to your computer
- Unzip the downloaded file and flash it to your device
After downloading the knowledge pack, follow the instructions associated with your firmware for flashing it. Instructions for flashing are found in the QORC SDK or the SensiML documentation.
Live Test Using the SensiML Gateway
Being able to rapidly iterate on your model is critical when developing an application that uses machine learning. To facilitate validating in the field, we provide the SensiML Gateway. The Gateway allows you to connect to your microcontroller over serial, Bluetooth, or TCP/IP and see the classification results live as they are generated by the Knowledge Pack running on the microcontroller.
The following video walks through:
- Downloading the Knowledge Pack library
- Compiling the library into the QORC-SDK
- Flashing the SparkFun Thing Plus - QuickLogic EOS S3
- Viewing the live results using the SensiML Gateway
Summary
We hope you enjoyed this tutorial using the SensiML Analytics Toolkit. In this tutorial we have covered how to:
- Collect and annotate a high-quality data set
- Build a query as input to your model.
- Use SensiML AutoML to search for an edge-optimized model.
- Use the SensiML Analytic Studio to test the model offline.
- Use the SensiML Streaming Gateway to view results from the model running on the device in real-time.
For more information about SensiML visit our https://sensiml.com. To work with us to enable you to build your application get in touch with us.
About QuickLogic & SensiML
QuickLogic is a fabless semiconductor company that develops low power, multi-core MCU, FPGAs, and embedded FPGA Intellectual Property (IP), voice, and sensor processing. The Analytics Toolkit from our subsidiary, SensiML Corporation, completes the end-to-end solution by using AI technology to provide a full development platform spanning data collection, labeling, algorithm and firmware auto-generation, and testing. The full range of solutions is underpinned by open source hardware and software tools to enable the practical and efficient adoption of AI, voice, and sensor processing across mobile, wearable, hearable, consumer, industrial, edge, and endpoint IoT.