Project update 5 of 10
Power System Load Response
In this update we wrap-up power system testing by adding high-bandwidth voltage and current measurement hardware to the test setup, which allows for load-response characterization to be done.
Power System Test Hardware
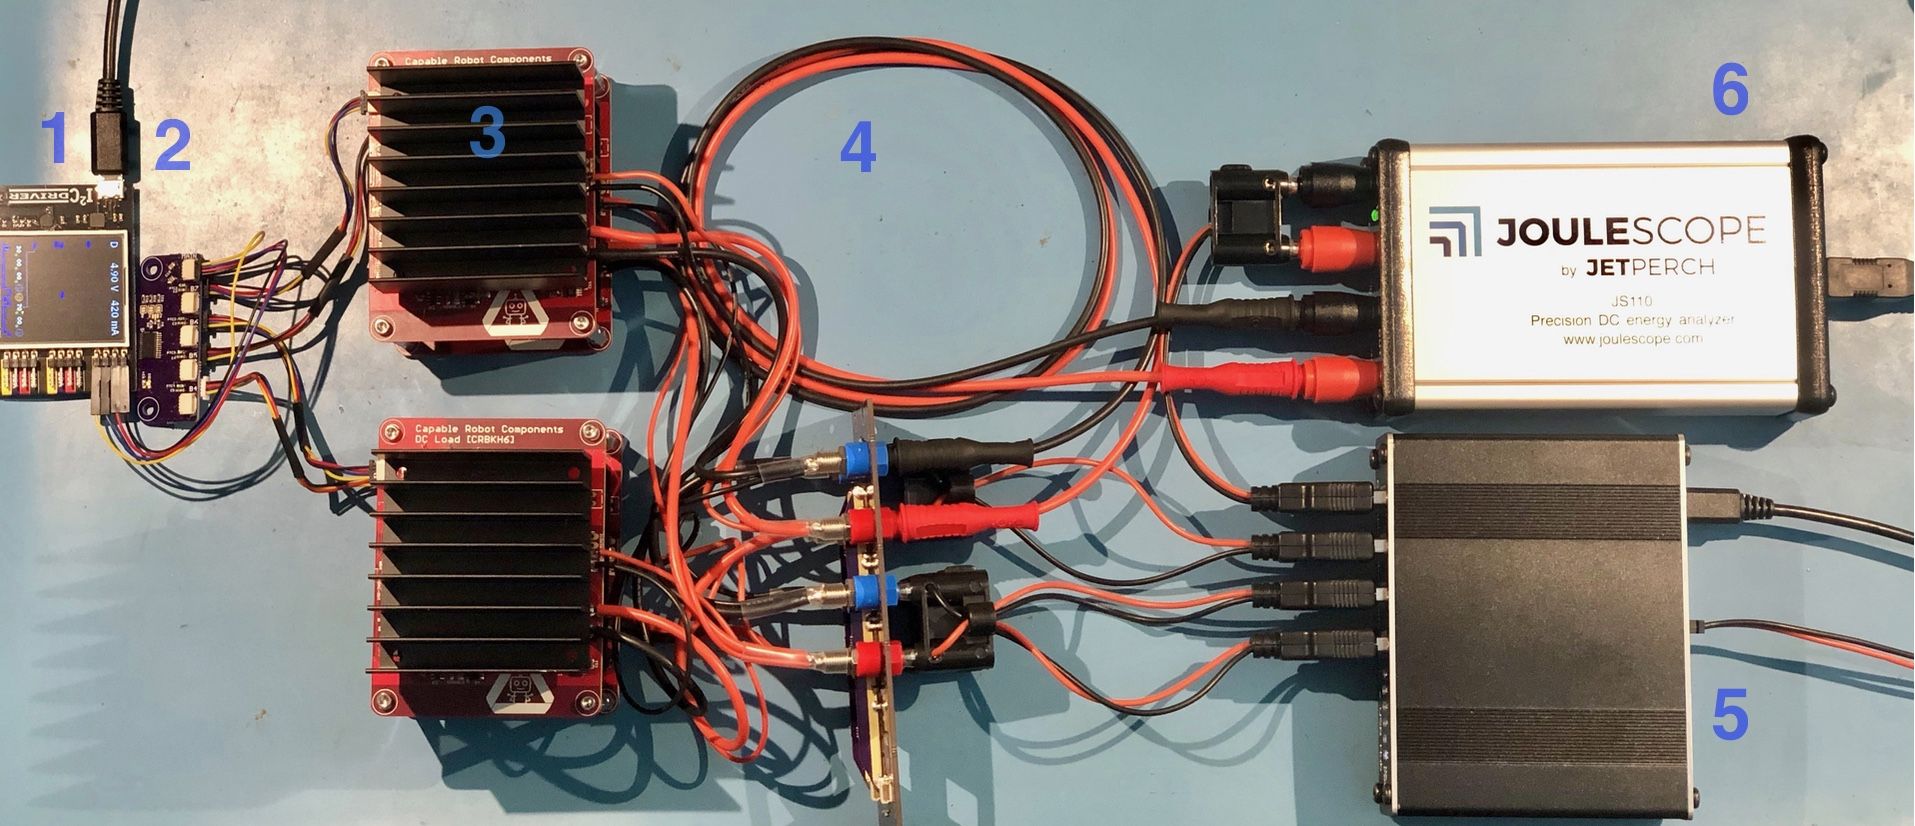
From left to right, it consists of:
- I2C Driver : USB to I2C bridge connected to a control computer.
- TCA9548A Breakout Board : A 1:8 I2C bus switch, allowing downstream I2C buses to have identical devices and addresses.
- 4x Electronic DC Loads : These can operate in a constant voltage or constant current mode, and can create a load of up to 24 V or 3A.
- Interface wiring between DC Loads and USB A connectors
- A Programmable USB Hub under test (commonly referred to Device Under Test or DUT). The Hub is also connected to the control computer to allow the Hub's reported state to be monitored and controlled.
- A JouleScope connected between the USB Hub's Port 1 and that electronic DC Load.
Joulescope is a new USB instrument which synchronously measures voltage and current at 2 million samples per second, with 14-bit resolution. JouleScope’s current range has an equivalent of 32 bits of dynamic range, allowing for precise measurement from nA to A — but in this test we won’t be using that capability of the instrument, it will remain fixed in its’ amp range.
There are two test setups shown in the following graphs:
- Voltage response of a port when its' load is switched on and off rapidly. We'll call this 'Direct Load Response'.
- Voltage response of a port when its' neighbors load is switched on and off rapidly. This is called 'Indirect Load Response' below.
Direct Load Response
In the following test the load on Port 1 (the port that JouleScope is monitoring) is switched on and off in 100 ms intervals, and increases from 100 mA to 1,000 mA over the test.
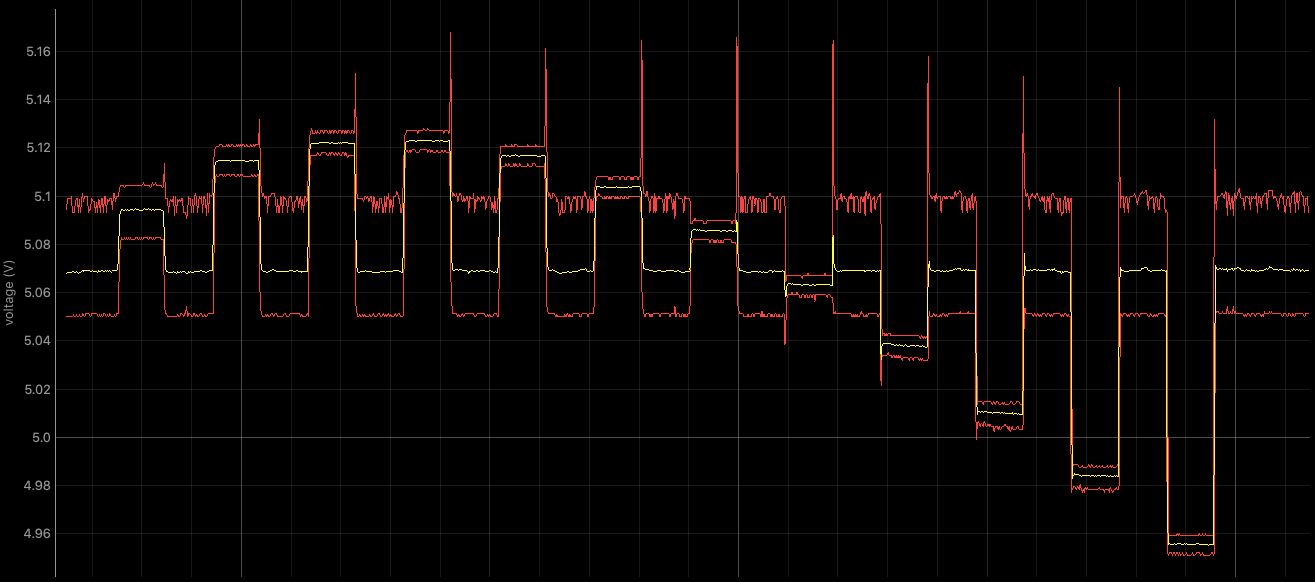
In all of these graphs:
- Top Graph (if shown): Port current.
- Bottom Graph (or if only one graph is shown): Port Voltage
- Yellow line shows the average voltage or current at that time-step
- Red lines show the minimum and maximum voltage or current at that time-step -- which allows transient responses to be caught and measured.
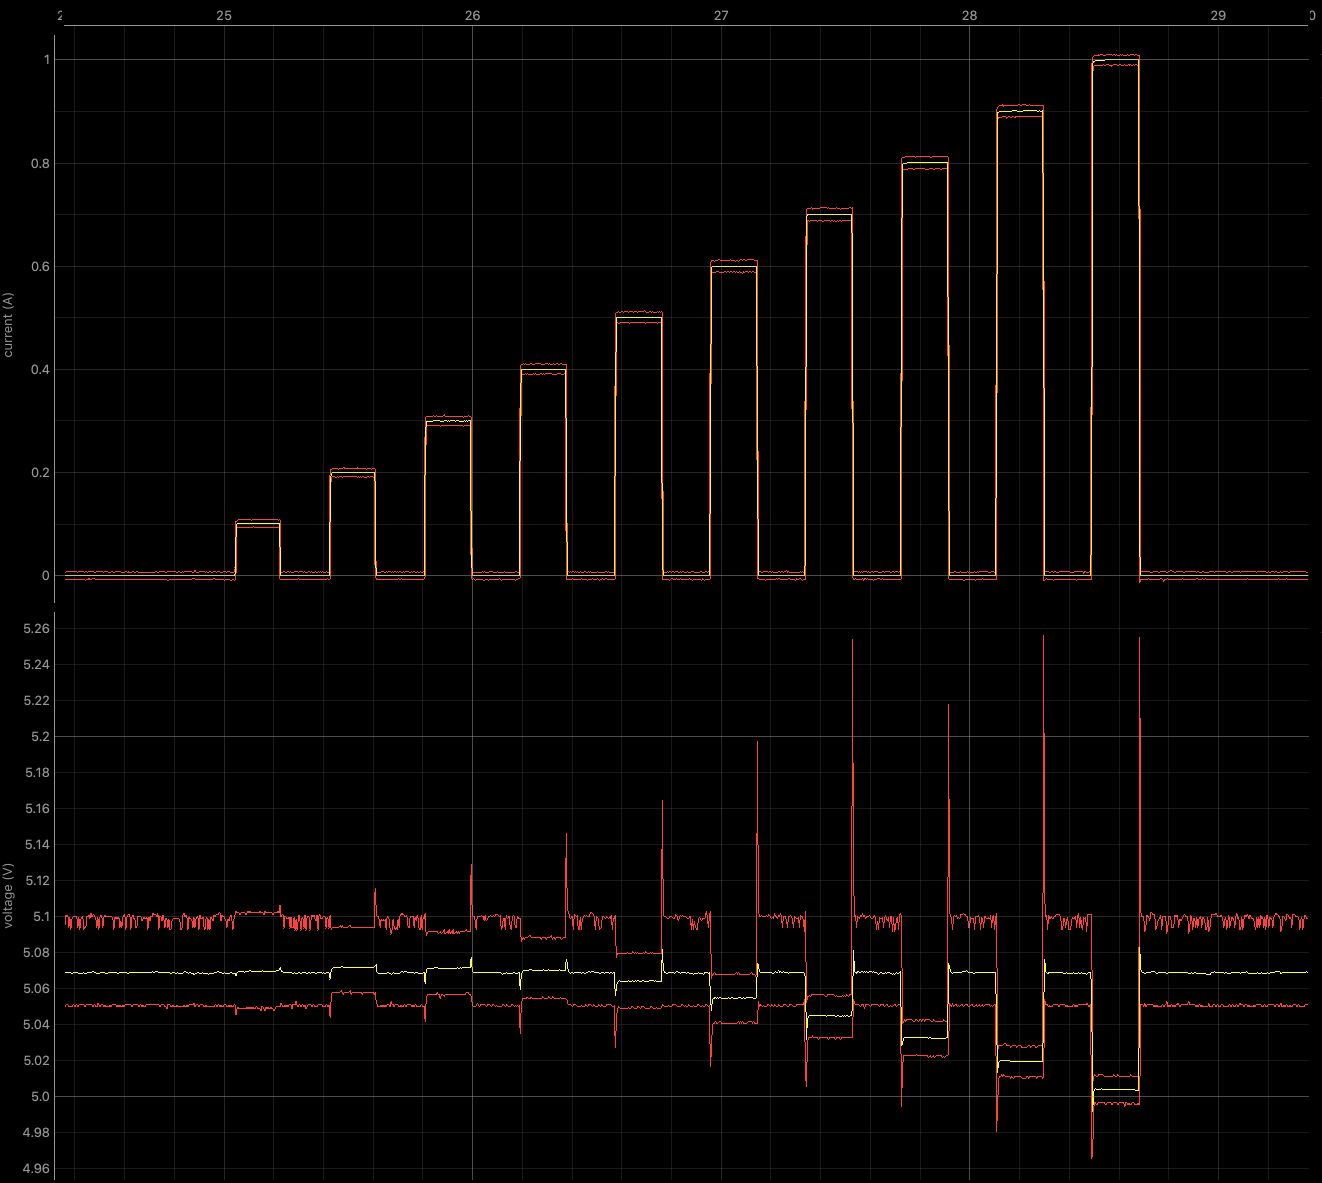
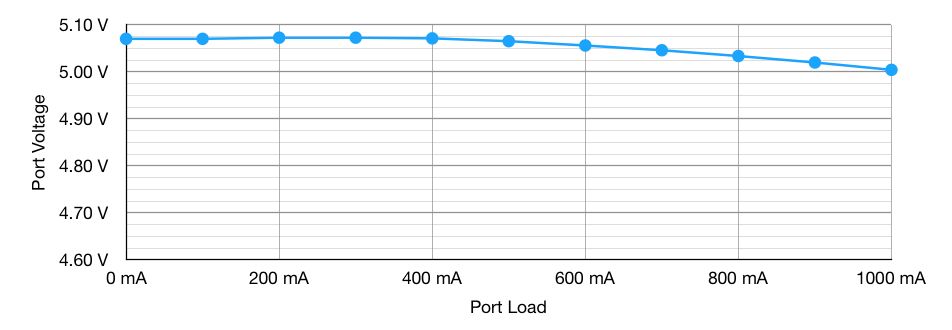
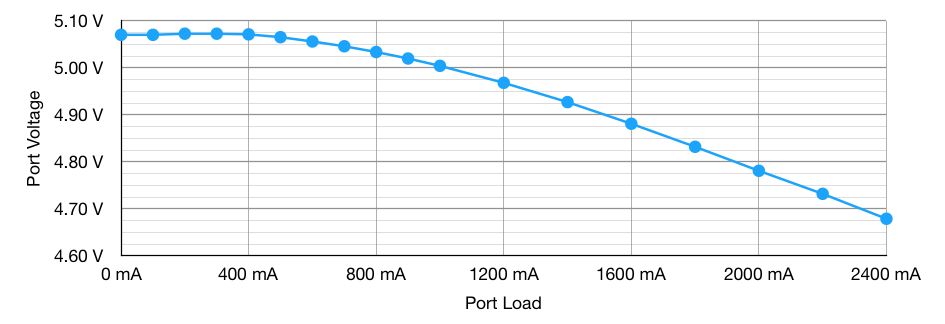
As in the testing shown last week, the output voltage drops as the load current increases. Here, JouleScope measures the following:
But due to the high-bandwidth measurement of the Joulescope, we can see and measure starting and stopping voltage transients when the load switches on and off.
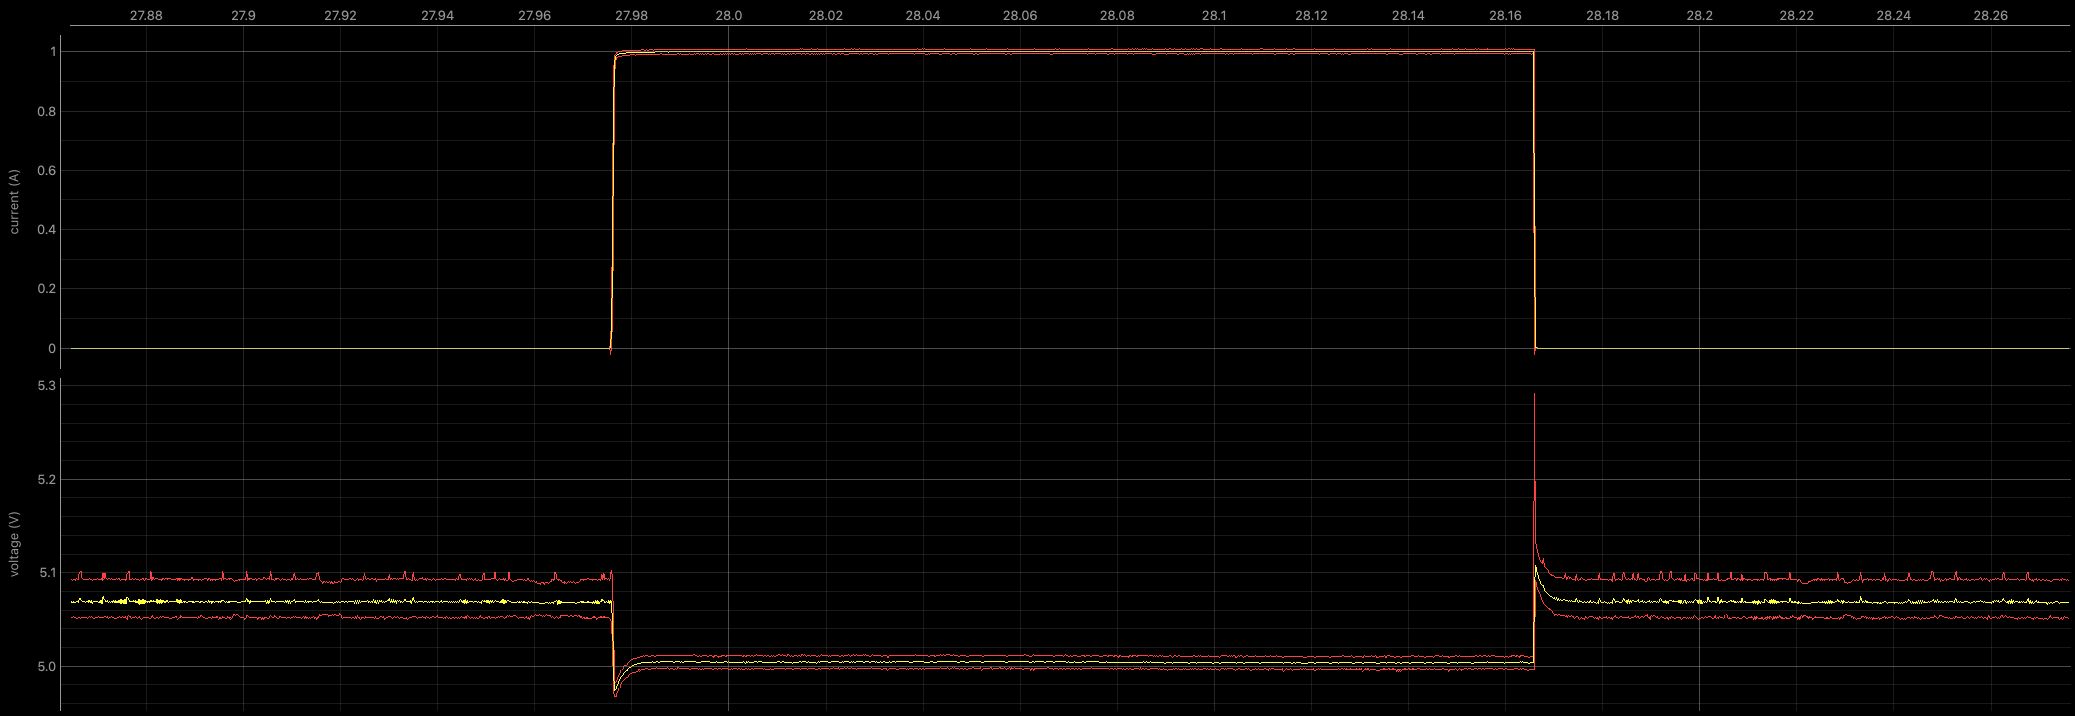
When a 1A load is switched on, the port voltage droops from 5.07 V to 4.98 V (a swing of 0.18 V). And when the load switched off, the port voltage briefly rose to 5.31 V before settling back at 5.07 V.
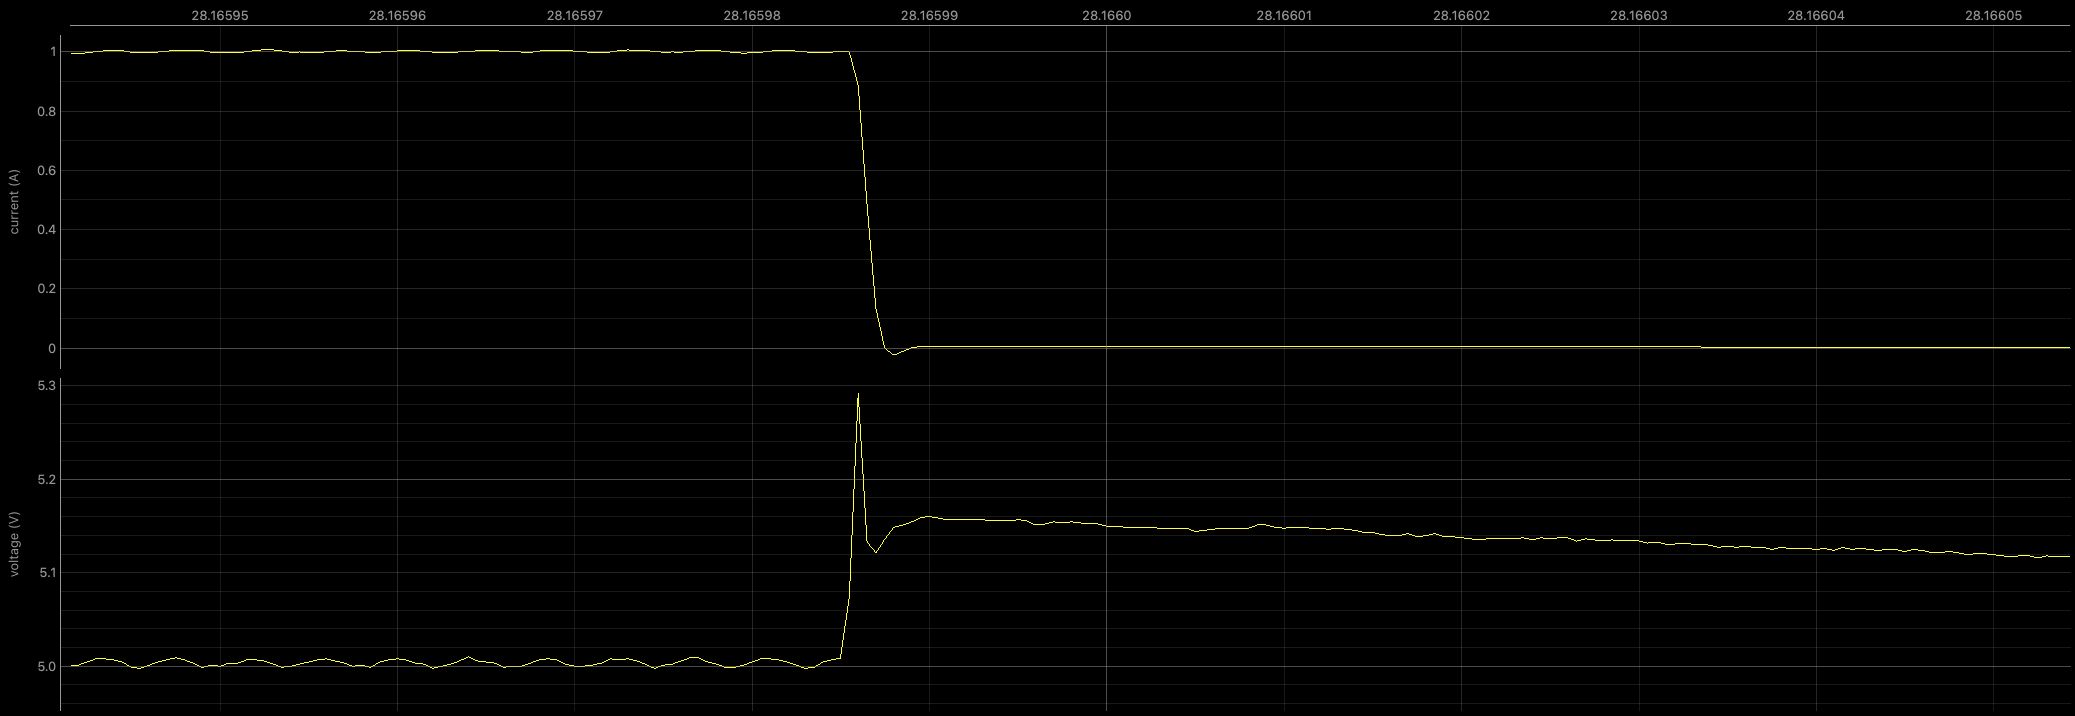
When you zoom into the load turning off, you get a sense of how quickly this load change occurs and how short the resulting voltage spike is. At this zoom level, each vertical tick line is 0.01 millisecond apart, and the load turns off in 0.0021 millisecond. The voltage spike is about 1/2 that duration, or 0.001 millisecond.
This minimal load response is quite remarkable.
Here is the same test, but with 200 mA load steps up to 2,400 mA of load:
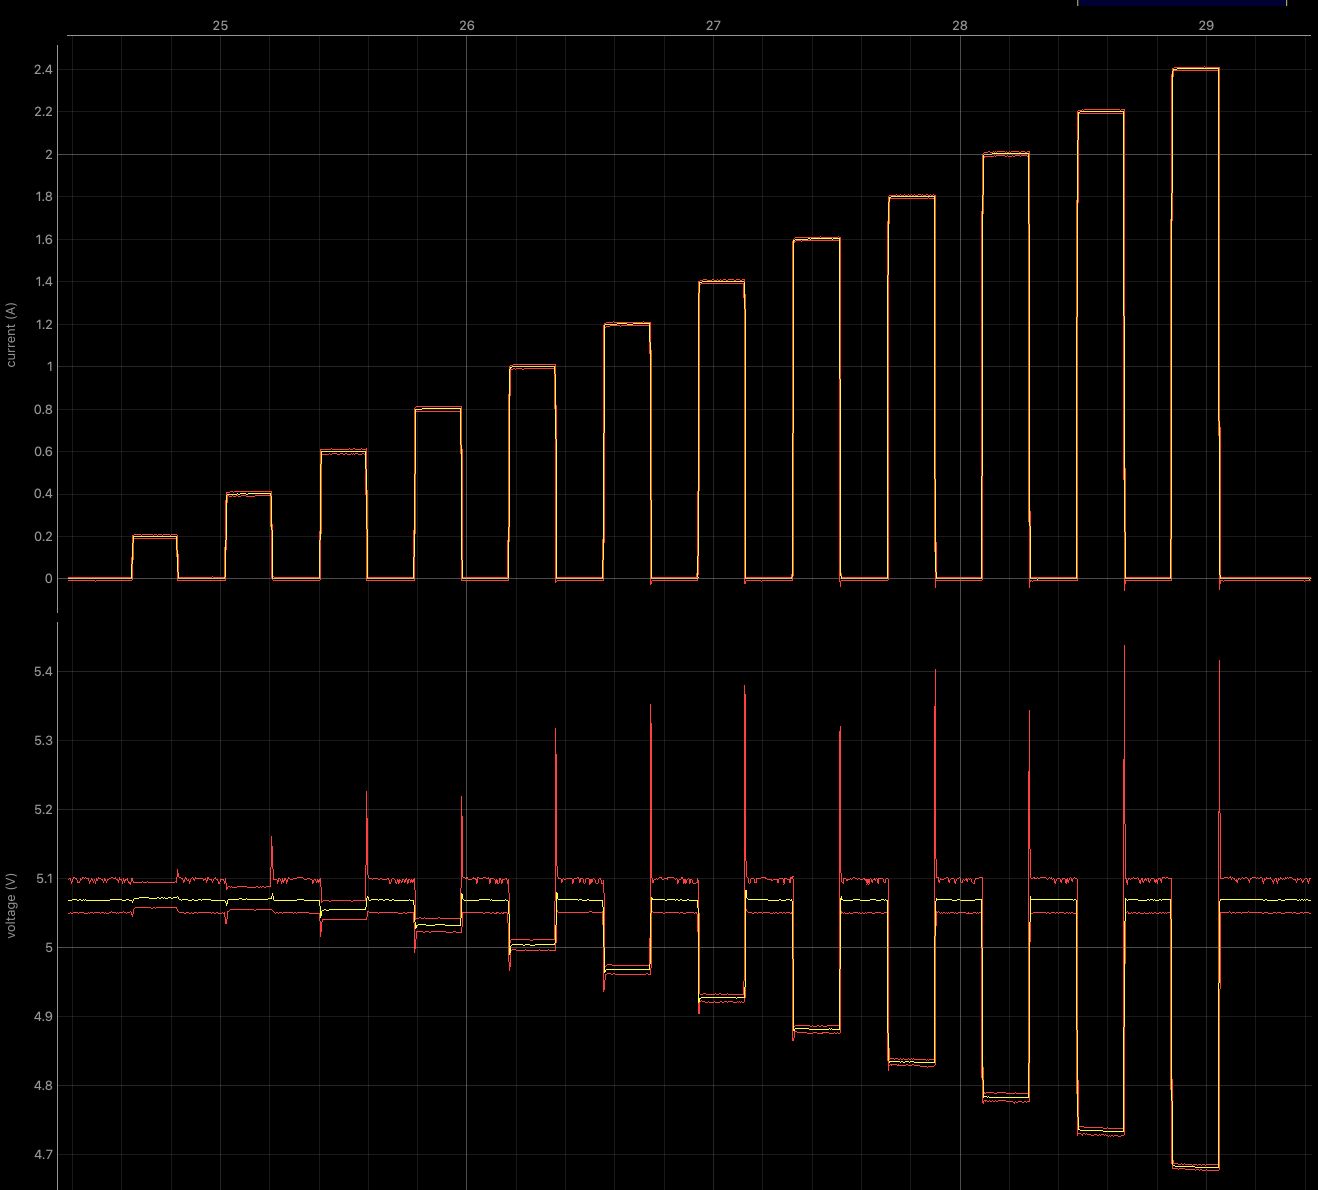
And the corresponding Bus Voltage (after the Hub’s downstream Port & measured by JouleScope).
You can see that at 2,200 and 2,400 mA, the bus voltage is slightly below the desired USB range of 4.75 to 5.25 V, but this measurement is also thru some external cabling which has its own losses.
Indirect Load Response
In these graphs, JouleScope is measuring voltage at Port 1, while load is being drawn from Port 2. In these results, the Port’s current graph is not shown because JouleScope is monitoring Port 1 which has no load.
These graphs show us how isolated the power on each port is from neighboring ports.
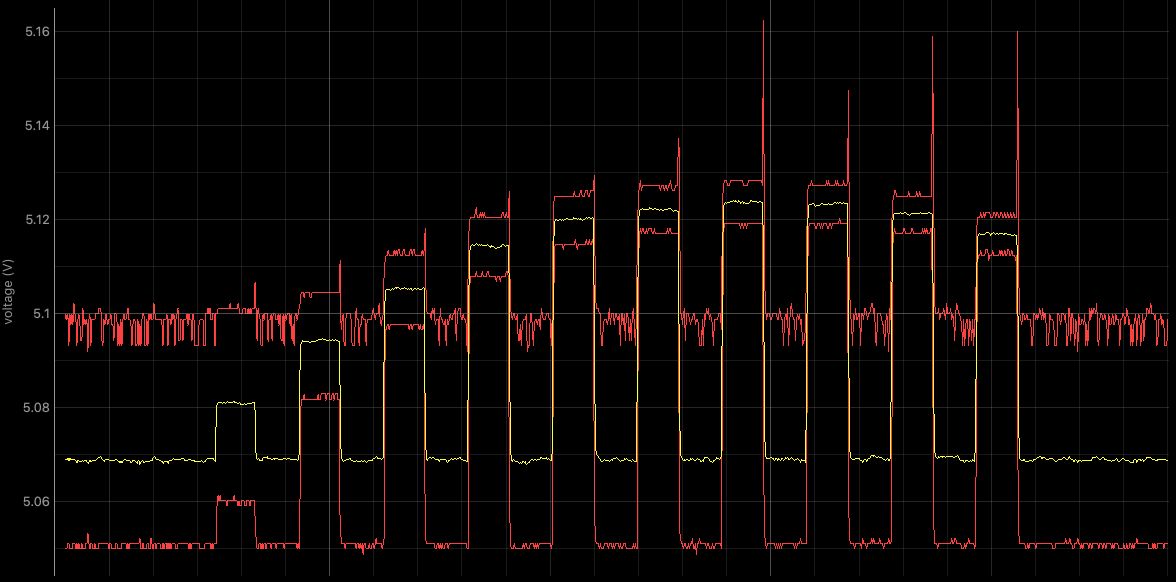
Interestingly, the load response is even better on the adjacent port. Instead of voltage spikes around 5.30 V they are around 5.15 V (about 50% of the amplitude). This is due to the per-port power isolation of the Programmable USB Hub.
And now we can update the voltage response curve above by adding a "Bus Voltage" curve to the "Port Voltage" curve measured on Port 1.
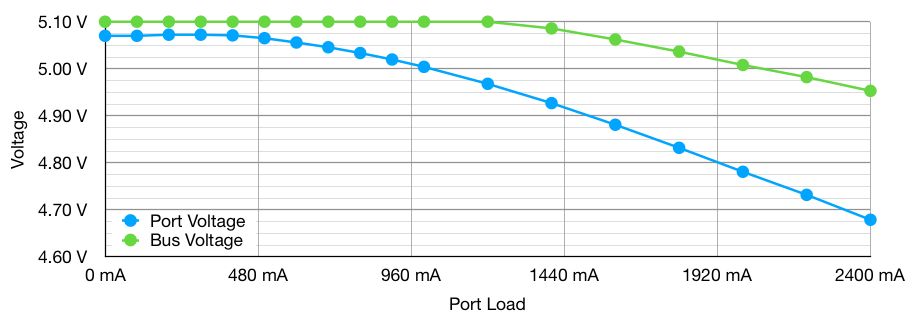
The voltage difference between these two lines is due to the voltage drop across the port power switch and the USB connector. In this test no load is being drawn from Port 1, so it JouleScope is measuring the regulated Bus Voltage, instead of the "Port Voltage" measured previously.
I hope you enjoyed this campaign update. Thanks again for all of your interest and support!