Project update 4 of 12
Turning ScopeFun into a Bode Analyzer Using the Python API
by Dejan PriversekTurning ScopeFun into a Bode Analyzer Using the Python API
ScopeFun provides a Python API that you can use to create your own applications. It allows you to build upon and extend existing ScopeFun features without modifying the source code. To demonstrate it’s use, we have created a Python script that turns ScopeFun into a Bode analyzer.
Setup
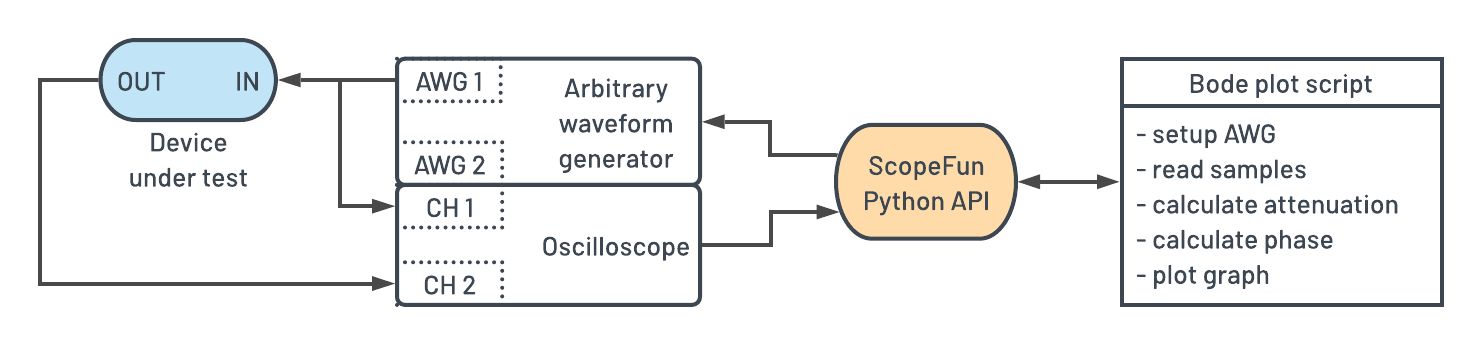
A Bode analyzer is an instrument that plots the frequency response and phase shift of the Device Under Test (DUT). Bode plots are commonly used to characterize filters and amplifiers. By looking at a bode plot, we can quickly determine if a system is stable or check its gain margin and phase margin. To create a Bode plot diagram, we will use the Python API to control ScopeFun’s Arbitrary Waveform Generator (AWG) and measure signals on its oscilloscope inputs. The following diagram describes how the signals are connected between ScopeFun and the DUT:
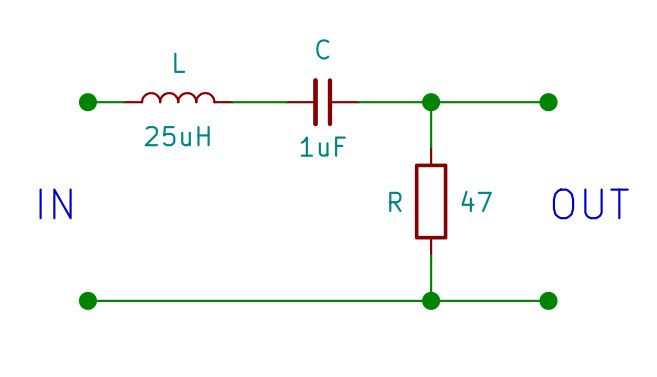
To test the Python script, we will use a passive RLC band-pass filter as our DUT. The selected components (L=25 uH, C=1 uF, R=47 Ohm) will set the center frequency of the band-pass filter to 31.8 kHz.
Python Script
The script is straightforward. It sets up a loop that sweeps the AWG output through the desired frequency range and measures signals on the oscilloscope inputs. The script automatically adjusts the oscilloscope input attenuation for each frequency step, to get the best dynamic range for measurements of amplitude and phase. The Python source code for this Bode analyzer is available on our GitLab repository. The following code snippet shows how the hardware configuration can be changed using a single line of code:
#set up AWG frequency, oscilloscope timebase and vertical scale
sethw(freq,xrange,VdivCh1,VdivCh2)
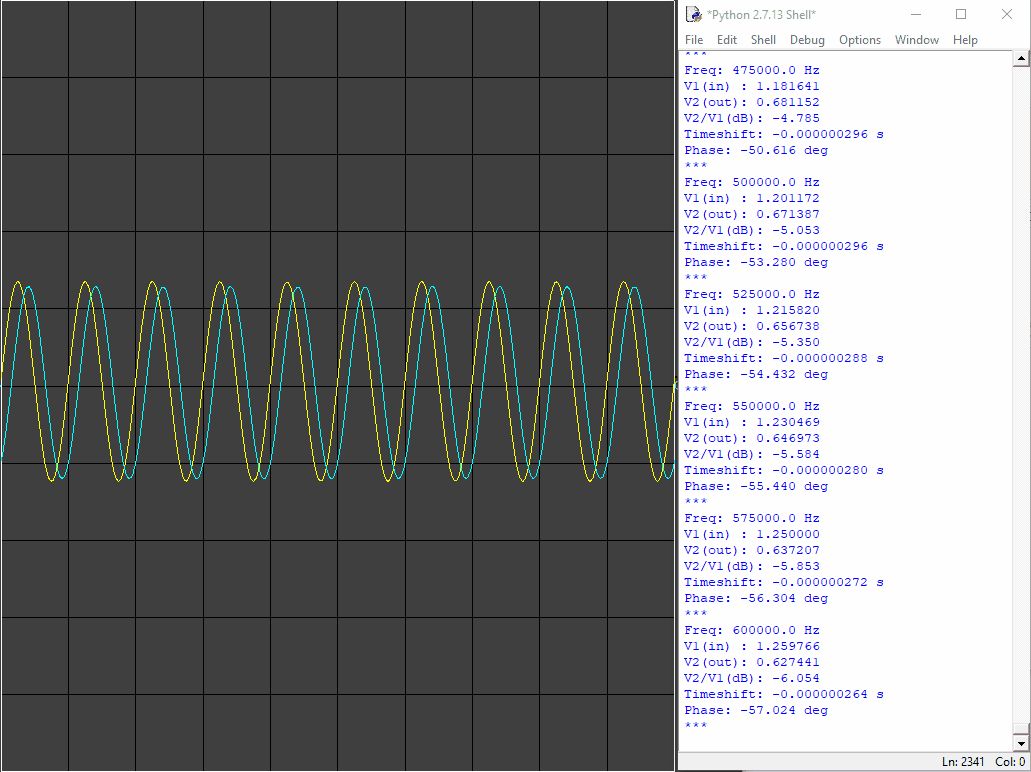
This is how the data is read from the ScopeFun inputs:
#print "sfHardwareCaptureFrame - header(1024)"
ret,transfered = scopefunapi.sfHardwareCapture(ctx,frame,1024,1)
#print "sfHardwareCaptureFrame - data(multiple of 1024)"
ret,transfered = scopefunapi.sfHardwareCapture(ctx,frame,40960,2)
Results
The script was set up to sweep through the AWG frequency range, from 1 Hz to 10 Mhz, with 40 frequency steps per decade:
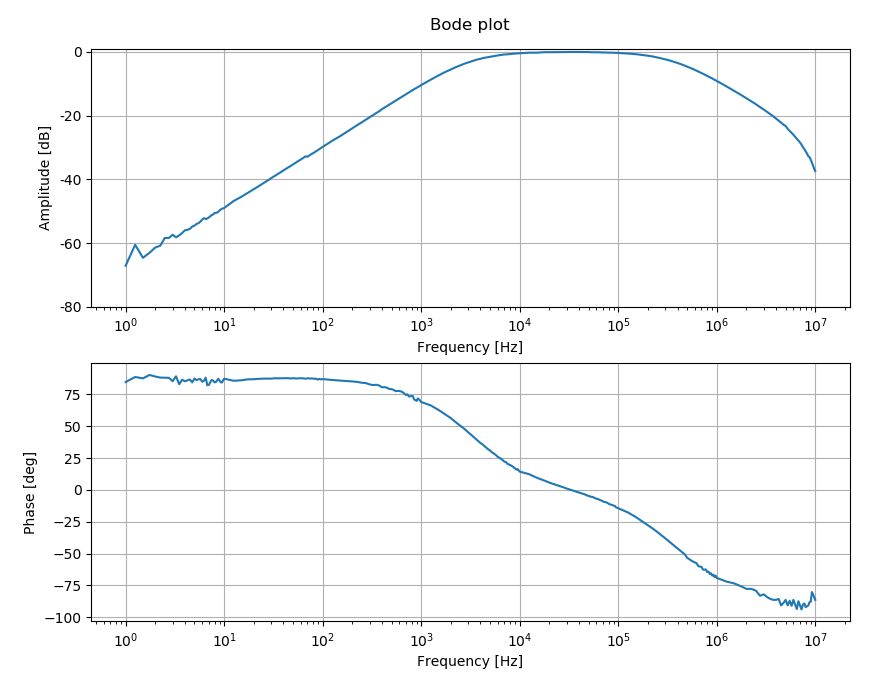
The result is a Bode plot diagram, as shown below:
Conclusion
The Python API provides a simple way to interface with ScopeFun’s hardware, which makes it a powerful tool for creating custom applications and dealing with complex measurement scenarios. In our example we have leveraged that API to create a Bode analyzer using only a few lines of Python code. While some manufacturers of test equipment charge extra for add-ons and extensions, ScopeFun allows you to create them easily and free of charge.